


How a Florida-Based Agency Saved 63 Hours a Month on Reporting
With a quarter-century of experience, Peak Seven is a leading advertising agency based in Florida, generating over 2 million leads for franchise businesses all across the United States.
The agency currently serves 25 clients, manages over 100 ad campaigns, and produces 25 detailed reports each month.
The Challenge: Time-consuming and Fragmented Tools
The Peak Seven team was using siloed tools—third-party connectors to gather and clean marketing data from various platforms, and then a visualization tool to create the reports. But this entire setup was slow, unreliable, and full of inefficiencies.
Third-party connectors frequently broke or lag, which meant the data on reports were either delayed, inaccurate, or simply non-existent.
A huge chunk of the team’s time went triple-checking the data on reports against the data on source platforms like Google Ads, rather than tweaking campaigns or communicating with clients.
Filters had to be inspected, connections re-verified, and date ranges checked—all to catch errors that would inevitably creep in week after week.
Creating reports on the visualization tool was equally painful. The Peak Seven team had to manually customize the tables, widgets, taking up to 4 hours per report.
The challenges didn’t stop with the internal teams—clients felt the frustration too. They wanted to track their accounts’ performance in real time, but broken data made that impossible. Worse, when errors popped up, it left clients questioning the entire report.
The Solution: A Faster, Smarter Way to Report
Peak Seven knew it was time to overhaul their entire reporting tech stack. Their goals were simple: save time, achieve data accuracy, and nurture transparency between clients and teams.
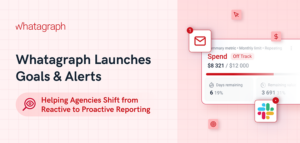
They tried out different marketing reporting tools in the market and successfully onboarded Whatagraph —a marketing intelligence platform that makes it easy to connect, visualize, share, and act on multichannel marketing data.
Whatagraph uses native connectors to pull data from 55+ marketing platforms which means there are no data inconsistencies or delays. Thanks to these native connectors, the data on reports now always match the source platforms like Google Ads or Meta Ads.
When it comes to creating reports, the Peak Seven team could easily put one together using Whatagraph’s pre-built templates or drag-and-drop widgets. No need to manually customize each report from scratch (unless they wanted to).
The Peak Seven team was also impressed by Whatagraph’s multi-source breakdown tables which showed any metrics from any sources and channels in one table. This made sure both the Account Managers and clients were aware of top-line KPIs at any given time.
The Peak Seven team even discovered a neat “trick” that would save them even more time. For franchise clients that had similar reporting needs, they created a “master” report template in their preferred design and formatting, and then re-used this template every time they onboard a new client. This significantly cut down report creation time.
These reports are also live—Peak Seven could simply share a link with the clients and they can see the campaigns are doing in real-time. This transparency is key to building trust, which helps retain clients for longer.
At any given point if the team runs into any technical roadblocks, they could simply reach out to Whatagraph’s live chat customer support which replies to messages within 1 minute and resolves most issues within 1 hour. This was a big breath of fresh air to the Peak Seven team who didn’t receive any customer support with their previous visualization tool.
Today, Peak Seven uses Whatagraph as the single source of truth for both clients and internal teams.
For clients, the team builds detailed reports and conducts performance analysis to prepare for their monthly, bi-weekly, or weekly meetings. Clients can also access these reports anytime via a shared link, and they see fresh, accurate data whenever they open one up.
Internally, Account Managers use Whatagraph to monitor campaign performance. Whatagraph shows all the KPIs and trends for each client and campaign in one view, which helps Account Managers quickly see which campaigns are off-track and take action right away.
The Results: Time Saved, Retained Clients
Switching to Whatagraph has transformed the way Kim and Peak Seven approach data and reporting.
What previously used to take 4 hours per report now only takes 1.5 hours or less with Whatagraph. Multiply that by 25 reports, and Peak Seven has saved a whopping 63 hours per month on reporting.
This efficiency further translates into $9,450 saved per month using the hours multiplied by the average retainer value.
What’s more, Peak Seven was even able to retain clients that were on the verge of churning by effectively proving the results the agency generated for them.
The sleek, accurate reports created by Whatagraph have also impressed both internal teams and clients. In fact, they are now a key part of Peak Seven’s client pitches where they highlight the always-accurate, 24/7 live reports that clearly show campaign performance and results.