Top 15 Most Important KPIs for a Digital Marketing Agency: Track Your Success in 2024
Understanding which marketing agency KPIs (key performance indicators) to monitor is perhaps one of the most important elements for a digital marketing agency. Not all KPIs provide valuable insights; selecting the right ones can be the difference between driving successful outcomes and stagnating in a competitive market like digital marketing.
In this article, we’ll equip you with the knowledge to discern and measure the most impactful marketing agency KPIs. Our expertise helps you cut through the noise, focus on actionable metrics, and provide the effectiveness of your campaigns!
Are you ready to elevate your marketing strategy with precise, result-oriented KPI tracking? Keep reading to discover the essential KPIs every agency for digital marketing needs to know in 2024.
Before diving in, here’s a brief summary of the 15 key marketing KPIs; click to jump to each section!
- Monthly Recurring Revenue (MRR) tracks steady income from subscriptions or contracts to gauge financial health (e.g., $5,000 MRR with 30 subscribers at $100/month and 40 at $600/year).
- Return on Investment (ROI) assesses the return on marketing efforts; for example, businesses earn $2 for every $1 spent on Google Ads.
- Project Profitability evaluates the profit margin of individual projects, helping agencies focus on the most profitable ones.
- Client Acquisition Cost (CAC) indicates the cost of acquiring a new client, with optimized strategies like CRO providing up to 223% ROI.
- Net Profit shows the revenue left after all expenses, which is crucial for making strategic decisions such as expanding teams or launching services.
- Billings per Full-Time Equivalent (FTE) tracks the revenue generated per employee, with higher billings indicating team efficiency.
- Time Invested in Project vs. Returns compares time spent on a project to its returns, ensuring efforts are aligned with profitability.
- Lead Sources identify the origin of leads, allowing agencies to diversify and safeguard against disruptions in lead generation.
- Average Cost Per Lead measures how cost-effective your lead generation strategies are by dividing total campaign spend by leads generated.
- Email Click-Through Rate (CTR) indicates how engaging email content is; a high CTR shows that messages resonate with recipients.
- Traffic to Lead Ratio reveals how effectively website traffic converts into leads, which is essential for optimizing conversion funnels.
- Lead Conversion assesses how well leads convert into paying customers, directly impacting overall profitability and return on investment.
- Marketing Qualified Leads (MQLs) track prospects engaged with your marketing; businesses with strong lead nurturing see 50% more sales-ready leads at 33% lower costs.
- Sales Qualified Leads (SQLs) measure leads ready for sales engagement, with aligned sales and marketing teams seeing 24% faster revenue growth.
Why Do You Need to Track KPIs for Marketing?
- See what’s working (and what’s not): Are those social media campaigns really bringing in new clients? Are people signing up for your email list after reading your blog? By tracking KPIs, you can see what’s actually moving the needle and what strategies might need a little tweaking.
- Show clients the value you bring: Numbers talk! When you can show potential clients how your marketing magic has boosted website traffic or increased leads for past clients, it’s a powerful way to win new business.
- Spend smarter, not harder. Imagine pouring all your budget into a fancy new marketing tactic, only to find out it’s a dud. KPI for digital marketing helps you identify which marketing channels give you the biggest bang for your buck, so you can optimize your spending on what works best.
- Become the marketing master: Tracking your own marketing agency KPIs is like getting a marketing Ph.D. The more data you collect, the better you’ll understand what makes your ideal clients tick and how to attract them like moths to a flame.
15 Most Important KPIs for a Digital Marketing Agency
Now you know why tracking the KPIs of your marketing agency is important. So, let’s take a look at the specific marketing agency metrics that can make a real difference when tracked. First up are the financial performance metrics. These marketing agency KPIs are foundational for any agency looking to survive and thrive. We believe once you understand and optimize these key figures, you’ll gain critical insights into your marketing agency’s financial health and operational effectiveness. Let’s explore how these agency marketing KPIs can empower your decision-making and support your agency’s growth.
Financial Performance Metrics
Monthly Recurring Revenue (MRR) & Monthly Recurring Profit (MRP)
Imagine trying to plan your monthly budget without knowing how much money you’ll have coming in – pretty tough, right?
That’s what it’s like for a digital marketing agency not tracking monthly recurring revenue. Forget us if we’re exaggerating but we’re confident to say that MRR is your agency’s financial heartbeat, showing you the steady income you’ll rake in each month from ongoing contracts. It is in fact a game changer for planning because it paints a clear picture of your cash flow. This way, you can budget, forecast, and strategize like a pro. If your MRR is on the rise, maybe it’s time to bring in some new team members or invest in that shiny new tool you’ve been eyeing.
Not sure how to calculate your MRR? Here’s a quick example:
If you have 30 subscribers paying $100/month and 40 subscribers paying $600/year:
MRR = (30 × 100) + (40 × (600 ÷ 12))
MRR = 3000 + 2000 = $5000
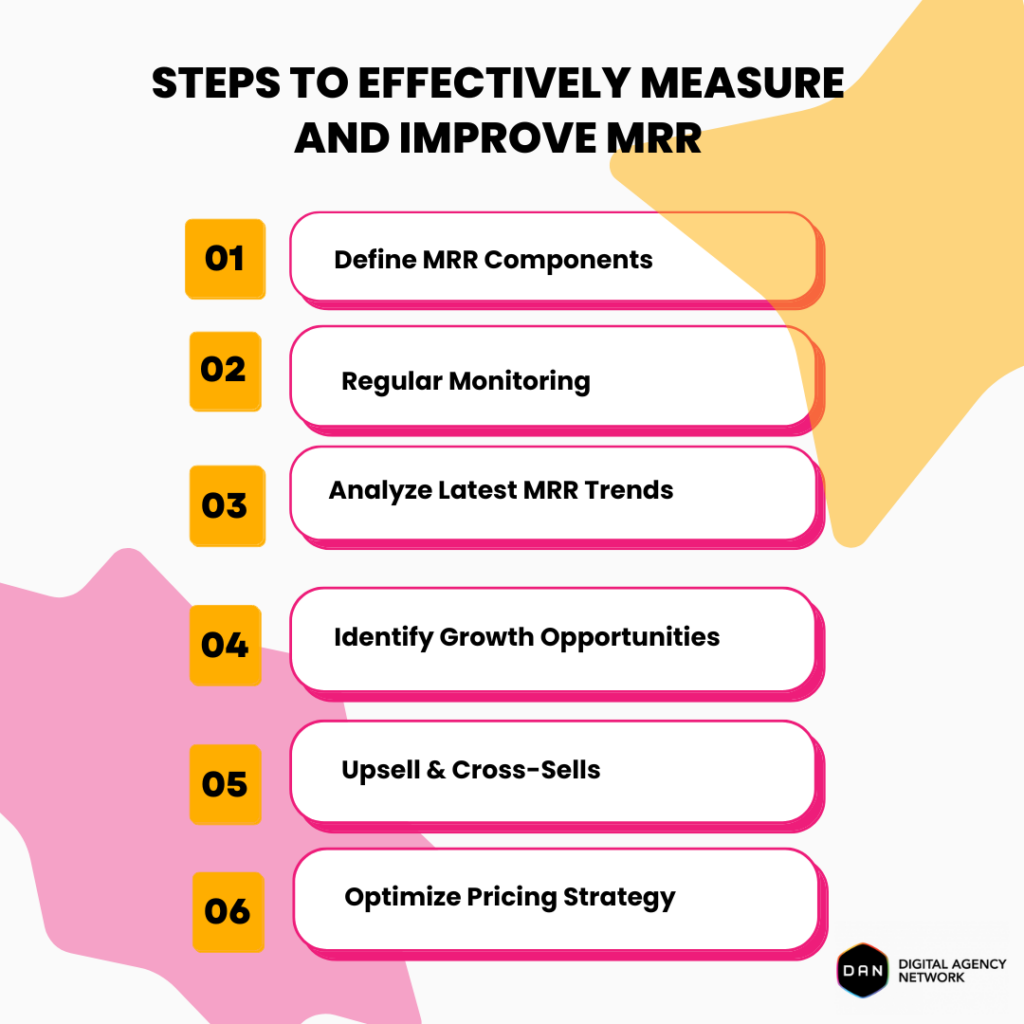
Alright, here’s a break down how you can get a grip on your MRR and make it even better:
Steps to Effectively Measure and Improve MRR
- Define MRR Components: First, get clear on what counts as MRR. This includes all your recurring revenue sources—subscriptions, retainer fees, and ongoing contracts. Knowing exactly what to track is the first step to getting accurate numbers.
- Regular Monitoring: Set up a routine to check your MRR regularly, like you would with your morning coffee. Monthly or even weekly check-ins will help you spot trends early and adjust your strategies accordingly.
- Analyze Latest MRR Trends: Look at your MRR trends over time. Is it going up, staying flat, or taking a dip? Analyzing these patterns helps you understand what’s driving your revenue and where you might need to tweak your approach.
- Identify Growth Opportunities: Look for ways to grow your MRR. This could mean upselling current clients, cross-selling additional services, or even revisiting your pricing strategy to make sure you’re not leaving money on the table.
- Upsell & Cross-Sells: Think of upselling and cross-selling like offering a gym member a personal training session or a nutrition plan on top of their regular membership. These strategies can significantly boost your MRR by providing more value to your clients and increasing their spend.
- Optimize Pricing Strategy: Just like adjusting gym membership fees to match market trends, revisiting your pricing strategy can help ensure you’re charging what your services are worth. Sometimes, a small tweak in pricing can lead to a big boost in your MRR.
But, MRR is just part of the story. You also need to know your Monthly Recurring Profit (MRP)—what you actually keep after all expenses. Think of MRP as your profitability pulse! Monitoring this helps you understand if your revenue is just vanity metrics or if it’s translating into real, sustainable profit. For instance, if your recurring marketing agency profit margins are improving, it might be the perfect time to scale up those successful campaigns.
So, think of MRR and MRP as your financial scorecard, helping you see both the money coming in and the profit you get to keep. This way, you can make smart decisions about where to cut costs or where there’s room to grow, ensuring your agency is always on the path to success.
Return on Investment from Marketing Campaigns
If you’re asking what the most telling KPI in digital marketing is, we’ll say Return on Investment from your marketing campaigns. Measuring ROI can be simplified as if you’re running a series of campaigns and want to know which campaigns or efforts are bringing the most clients and which ones are just not worth the effort. That’s exactly what measuring ROI in your marketing campaigns does for your agency.
Remember report cards in schools? ROI is the equivalent of a marketing report card. It helps you understand which types of campaigns are hitting it out of the park and which ones are just striking out. In fact, businesses can expect to see an average return of $2 in revenue for every $1 spent on Google Ads, demonstrating how effective high-ROI campaigns can be at bringing in value.
- Identify Winning Campaigns: High ROI campaigns are your all-stars. These are the campaigns that bring in the most bang for your buck. When you spot a high performer, it’s a clear sign to double down and scale up those efforts. Think of it like adding more of your most popular fitness classes to the schedule.
- Optimize Marketing Spend: Knowing your ROI helps you allocate your marketing budget more effectively. Instead of pouring money into tactics that aren’t working, you can focus your resources on strategies that drive results. It’s about spending smarter, not harder.
- Strategic Adjustments: Low ROI campaigns are like a red flag. They signal that something isn’t working and it might be time for a re-think. Maybe the messaging is off, or perhaps the channel isn’t right for your audience. Whatever the reason, tracking ROI allows you to make strategic adjustments before wasting more resources.
- Demonstrate Value to Clients: Numbers talk! Being able to show clients the ROI from your campaigns is a powerful way to demonstrate the value you bring. It’s not just about the tactics; it’s about showing real, measurable results.
Calculating ROI is straightforward: subtract the campaign cost from the revenue generated, divide by the campaign cost, and multiply by 100 to get a percentage. This simple formula gives you a clear picture of your campaign’s effectiveness.
Project Profitability
Do you ever feel like some of your projects make more money than others? Knowing which is which helps you make smart decisions about which projects to keep, which to tweak, and which to maybe let go. That is what project profitability does for your digital marketing agency.
Project Profitability measures the margin your projects achieve after all expenses are accounted for. It’s like a spotlight shining on which projects are your cash cows and which ones might be draining your resources without enough return. Analyzing this marketing agency KPI helps you make informed decisions about which projects to pursue in the future and where your pricing strategy might need a little adjustment.
Think of it this way: if you know a particular type of project consistently delivers high profits, you’ll want to chase more of those. On the flip side, if a project is always in the red, it’s time to rethink your approach or digital marketing pricing. It’s all about maximizing profitability on a per-project basis.
Client Acquisition Cost
Understanding Client Acquisition Cost (CAC) is a must for any marketing agency that wants to get the most bang for its buck. CAC tells you exactly how much you’re spending to bring in a new client. This marketing agency KPI is essential because it helps you evaluate the efficiency and effectiveness of your marketing efforts. By optimizing client acquisition strategies, businesses can significantly reduce their CAC. For example, the median ROI on conversion rate optimization (CRO) tools is 223%, demonstrating the immense value in refining how you convert leads into clients.
Here’s how:
- Efficiency Evaluation: CAC shows you the cost-effectiveness of your marketing strategies. A lower CAC means you’re getting more clients for your digital marketing agency more efficiently, which is always a good thing. It indicates that your marketing campaigns are hitting the mark without draining your budget.
- Resource Allocation: Knowing your CAC helps you make smarter decisions about where to allocate your resources. If a particular campaign or channel is driving down your CAC, it makes sense to invest more in that area. On the flip side, if some efforts are leading to higher costs, it might be time to reassess and reallocate.
- Scaling Operations: A low CAC can also signal that you’re ready to scale. If you’re acquiring clients efficiently, you can expand your operations without worrying about proportional increases in acquisition costs. This means more growth for less money.
Net Profit
Let’s say you’ve run your gym for a month. You’ve counted all the memberships sold, subtracted the cost of new equipment, staff salaries, utility bills, and everything else. What’s left? That’s your Net Profit. It’s the bottom line, the true indicator of your agency’s financial health.
Net Profit shows you how much money you’ve really made after covering all your expenses. This number is important because it tells you whether your agency is truly profitable or if there are areas where you need to tighten the belt.

A few reasons why Net Profit is an important KPI for digital marketing agencies:
- Major Strategic Decisions: Whether you’re considering expanding your team, launching a new service, or entering a new market, Net Profit gives you the green light—or the red flag. If you’re consistently seeing a healthy net profit, it might be the perfect time to invest in growth.
- Rewarding Staff: Your team works hard, and when the numbers are good, you can think about rewarding that hard work. Bonuses, raises, or other perks can boost morale and productivity, helping your agency perform even better.
- Planning for Economic Downturns: No one likes to think about tough times, but they happen. A solid Net Profit means you have a cushion to fall back on, giving you the flexibility to navigate economic downturns without panic.
- Pivoting Strategies: A dip in Net Profit is like a warning light on your dashboard. It tells you something’s not quite right and it’s time to investigate. Maybe your latest campaign isn’t performing as expected, or perhaps operational costs are creeping up. Whatever the reason, monitoring Net Profit helps you pivot strategies swiftly to boost profitability.
Now, let’s get practical. To work out your bottom line profitability percentage, you need two figures: revenue and net income. Your net income is your profit after paying all fees and running costs. Here’s the formula: divide your net income by your revenue and multiply by 100. This gives you the profitability percentage, showing how much profit you make for every dollar of revenue.
Efficiency and Productivity KPIs
Billings Per Full-Time Equivalent (FTE)
Another key marketing agency KPI to understand your team’s productivity and your agency’s operational efficiency is FTE. This KPI measures the revenue each team member generates, giving you a clear picture of how effectively your team is working.
High billings per FTE suggest that your team members are highly productive and efficient in their roles. It means they’re contributing significantly to the agency’s revenue, which is a great indicator of a well-functioning team. Plus, when you see strong numbers in this KPI, it might be time to consider expanding your team. High productivity levels can justify bringing in more staff to support growth and handle increased workloads without compromising on quality or efficiency.
On the flip side, if your billings per FTE are lower than expected, it’s a sign that something might be off. It could indicate that your team needs additional training, better tools, or more streamlined processes. Addressing these issues can help boost overall productivity and efficiency.
In addition, understanding this KPI helps you allocate resources more effectively. If certain team members or departments are generating more revenue, you can focus on supporting those areas to maximize your agency’s performance.
Time Invested in Project vs. Returns
You need to ensure the hours you and your team put into a project are actually paying off. You can think of it as checking if all the efforts you’re pouring into a garden is resulting in a bountiful harvest. If you’re spending lots of time but not seeing the fruits of your labor, something’s off.
Tracking the time invested in each project and comparing it to the returns generated gives you a clear picture of whether the time spent is translating into profits. If the returns aren’t stacking up, it might be time to reassess your project management strategies and see where improvements can be made. This digital marketing key performance indicator is crucial for understanding if your marketing efforts are worth the trouble. If you find you’re making less money than you would expect, it’s definitely time to take a closer look at your current strategies.
So, how do you do this? Start by logging the hours spent on each project. Then, pitch these hours against the profit generated since you began. This will help you see if your time is being well spent or if adjustments are needed.
Marketing Effectiveness KPIs
Lead Sources
If you want to achieve long-term success for your business, perhaps defining your lead sources is one of the most important KPIs. Knowing your lead sources helps you identify effective strategies for generating new clients. If all your leads come from one source, you’re putting your business at risk. Imagine the impact that the source dries up due to something like a server crash or a store closure. To safeguard against this, you can create a chart that shows your sales by lead source as percentages of total sales. This chart can help you see where you need to diversify. You’ll protect your business from potential disruptions and optimize your lead generation strategy, by spreading your efforts across multiple lead sources. Remember: diversifying your lead sources is key to maintaining a steady flow of new clients and sustaining growth.
Average Cost Per Lead
With the help of Average Cost Per Lead KPI you can identify which channels deliver leads at the lowest cost, allowing you to optimize your marketing spend and focus on the most cost effective strategies. If you notice an upward trend in this cost, it might be time to reassess your tactics or explore new channels. Beyond just calculating the cost per acquisition, you need to understand how much each lead is costing your client can reveal if there’s a deeper issue with your sales strategy rather than your marketing approach. Since the average cost per lead can differ between industries, it’s also beneficial to benchmark against your client’s sector. To calculate the cost per lead, simply divide the amount of money spent on a campaign by the number of leads generated.
Engagement and Conversion Metrics
Now, it’s time to dive into two key metrics that show how well your marketing efforts are turning interest into action: Email Click-Through Rate (CTR) and Traffic to Lead Ratio. These agency marketing KPIs provide information on how effectively you’re engaging your audience and converting them into leads. However, for email marketing agencies in particular, email CTR takes center stage.
Email Click-Through Rate (CTR)
Ever wondered if your email marketing is hitting the mark? Measuring your CTR will tell you just that. To calculate it, divide the number of clicks your marketing email generates by the total number of emails sent, then multiply by 100. For instance, if you get 1,000 clicks from 10,000 emails, your CTR is 10%. A high CTR means your emails are resonating with your audience, while a low rate suggests it’s time for a creative refresh.
Traffic to Lead Ratio
This metric helps you see how well your website traffic converts into leads. It’s simple to calculate: divide the total number of visitors by the number of leads generated, then multiply by 100 to get a percentage. For example, if your website gets 1,000 visits a month and brings in 100 new leads, your traffic to lead ratio is 10%. This KPI is crucial for refining your marketing funnels, making sure you’re not just attracting visitors, but the right kind of visitors who are likely to convert.
For example, if your website gets 1,000 visits a month and brings in 100 new leads, your traffic-to-lead ratio is 10%. This KPI is crucial for refining your marketing funnels, making sure you’re not just attracting visitors, but the right kind of visitors who are likely to convert.
MQLs and SQLs
Marketing Qualified Leads (MQLs) and Sales Qualified Leads (SQLs) are also crucial players in your sales funnel. MQLs and SQLs are key indicators of how well your lead generation and nurturing processes are working.
Marketing Qualified Leads (MQLs): MQLs are prospects who have shown enough interest and engagement to be considered potential buyers. They might have downloaded a whitepaper, subscribed to your newsletter, or attended a webinar. These actions show they are intrigued by what you offer but are not quite ready to make a purchase yet. Tracking MQLs helps you understand which marketing activities are effectively drawing interest and nurturing potential leads. On average, companies that excel at lead nurturing generate 50% more sales-ready leads at 33% lower cost.
Sales Qualified Leads (SQLs): SQLs are a step further down the funnel. These leads have demonstrated a clear intent to purchase, such as requesting a demo or speaking with a sales representative. They’re primed for a direct sales approach. By focusing on SQLs, your sales team can prioritize their efforts on prospects most likely to convert, ensuring that their time and resources are used efficiently. Research shows that organizations with tightly aligned sales and marketing functions achieve 24% faster three-year revenue growth and 27% faster three-year profit growth.
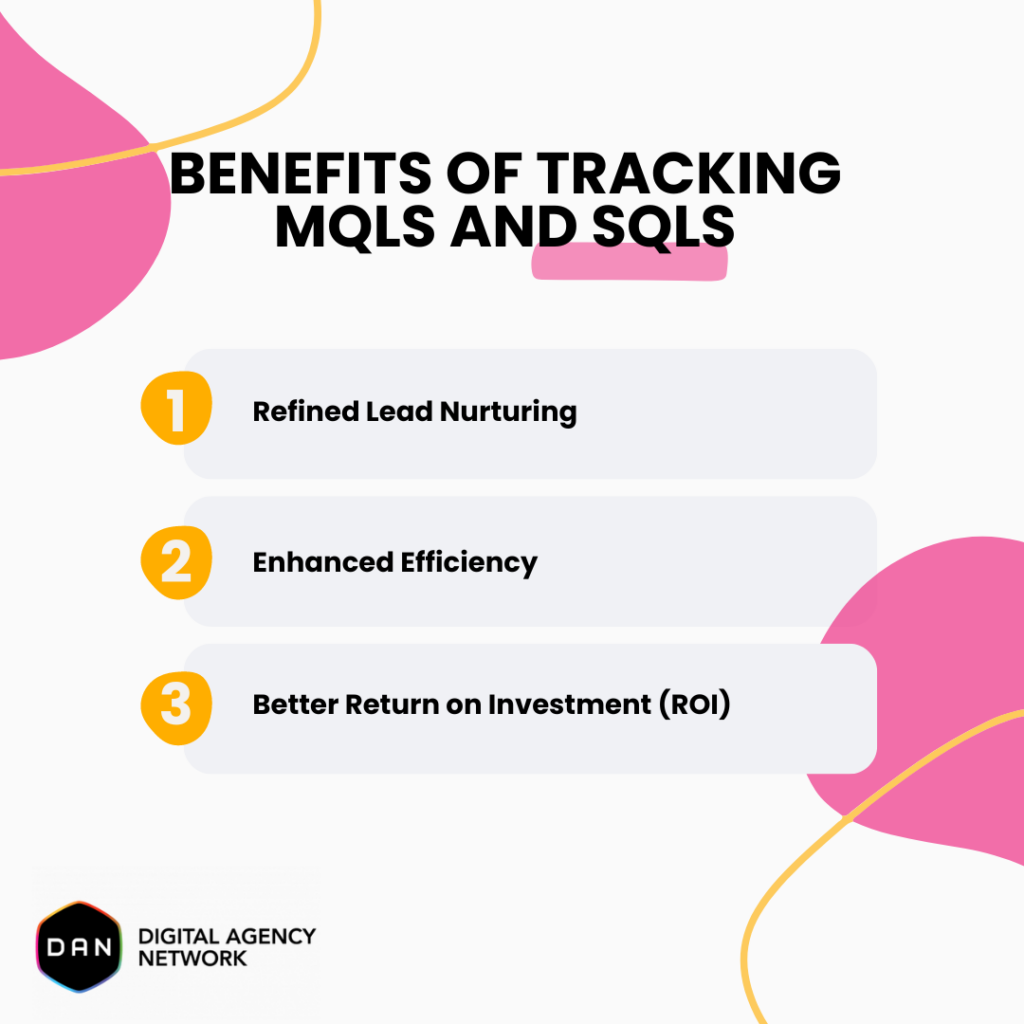
Tracking MQLs and SQLs offers several benefits:
- Refined Lead Nurturing: By distinguishing between MQLs and SQLs, you can tailor your marketing and sales efforts more precisely. MQLs need more nurturing content, while SQLs are ready for more direct sales engagements.
- Enhanced Efficiency: Knowing which leads are ready for a sales push helps your sales team focus on high-probability prospects, improving conversion rates. Companies with effective lead management see a 10% or greater increase in revenue in 6-9 months.
- Better ROI: By effectively tracking and converting MQLs to SQLs, you can optimize your marketing spend, ensuring that resources are directed toward activities that drive sales.
Lead Conversion
Think of lead conversion as your closing rate—how good are you at sealing the deal? How strong are your marketing and sales teams at converting leads into actual sales?
If you’ve got plenty of leads but few are becoming paying customers, there could be an issue with how you attempt to close the sale. Are your sales pitches resonating with your prospects? Is your follow-up process good enough? These are the questions you need to ask.
There are a few reasons why monitoring lead conversion is important; you can identify weaknesses in the sales funnel, improve sales strategies, optimize marketing campaigns, and measure ROI.

A low conversion rate signals potential issues in your sales process. It might be an indication that your leads aren’t being nurtured effectively, or there could be a disconnect between your marketing messaging and sales approach. But once you get the grip of your conversion rate, you can adjust your sales techniques. Perhaps additional training for your sales team, refining your sales scripts, or implementing better follow-up procedures might be helpful steps to get started.
High conversion rates from certain campaigns can also shape your future marketing efforts. You’ll know which strategies are most effective at generating leads that are ready to buy, helping you allocate your marketing budget.
Finally, remember that lead conversion rate directly impacts your return on investment. Enhancing overall profitability, higher conversion rates mean more sales for the same amount of leads.
Now, let’s talk about SEO Conversion Rate, which is closely linked to your lead conversion efforts. Especially measured by SEO agencies, the SEO conversion rate shows how effective your search engine optimization (SEO) efforts are at turning website visitors into leads. As organic traffic from search engines is often highly targeted and can result in higher conversion rates, it is equally important.
One way to boost your SEO Conversion Rate is by increasing the number of inbound links to your site. Inbound links are essentially endorsements from other websites, and they help improve your search engine rankings. The more high-quality inbound links you have, the better your site will rank. You can use various SEO tools to track these links and see how they’re impacting your traffic and conversions. Building inbound links can be achieved by creating high-quality guest posts for other blogs, which direct users back to your site.
Social Media Engagement
Another absolutely essential KPI is social media engagement, perhaps particularly more crucial for social media marketing agencies. If you’re managing social media campaigns, that means this metric is your bread and butter. It tells you if people are interacting with the content you post, which if your goal is to assess the effectiveness of your social media strategy, highly important.
Are your followers liking, sharing, and commenting on your posts? If not, it might be time to rethink your content approach. Measuring social media engagement is straightforward and incredibly insightful. Here’s how you can do it:
- Pin Down a Reporting Period: Decide on the time frame you want to analyze—whether it’s weekly, monthly, or quarterly.
- Collect Engagement Data: Gather data on likes, shares, comments, retweets, and any other relevant interactions across platforms like Facebook, Twitter, Instagram, and LinkedIn.
- Calculate Engagement Rate: Add up all the interactions, divide by the total number of followers, and then multiply by 100. For instance, if you have 1,000 interactions and 10,000 followers, your engagement rate is 10%. The average engagement rate across Instagram for many industries, for example, ranges from 3.7% to 6.8% according to Hootsuite’s data, and Facebook engagement averages between 2.1% to 5.9%. So, it’s important to benchmark your performance against these figures.
This KPI is particularly valuable for social media marketing agencies because it directly reflects the impact of your efforts. A high engagement rate means your content resonates with your audience and encourages them to interact. While boosting your visibility, this also builds a community around your agency or brand.
Client Relationship KPIs
Lifetime Customer Value (LCV)
A customer shouldn’t just buy one product or service and then disappear. That’s what the lifetime customer value KPI is all about, and it’s a crucial KPI if you market a subscription service. If you’re looking for insights into your client relationships, then here are two KPIs you should be looking into: Lifetime Customer Value (LCV) and Customer Retention Rate.
LCV is all about the total revenue you can expect from a customer throughout their entire relationship with your business. This KPI is particularly important for subscription-based services. To calculate LCV, start by finding out your churn rate—the percentage of subscribers who cancel each month.
For example, if you have a 2% monthly churn rate, the average customer lifetime is 1 divided by 0.02, which equals 50 months. Next, determine the gross profit per customer after accounting for the cost of providing your service. Multiply your monthly gross margin per customer by (1 divided by churn rate) and then multiply this figure by the average monthly revenue per customer.
Customer Retention Rate, on the other hand, measures the percentage of clients who continue doing business with you over a specific period. High retention rates indicate strong client relationships and effective client management, which are essential for sustainable growth. To calculate this, subtract the number of new customers acquired during a period from the total number of customers at the end of the period, then divide by the number of customers at the start of the period and multiply by 100.
High values in these metrics signify that you’re not only attracting customers but also keeping them engaged and satisfied. This reduces your need to constantly spend on acquiring new clients, saving costs, and boosting overall profitability. If you notice a sudden drop in retention rates, it’s a signal to review your customer service and account management strategies to identify and address issues.
Goal Completions
Last but not least, setting and achieving specific goals is obviously a fundamental part of any business strategy, and tracking how often your agency meets these goals can help you understand the overall effectiveness and areas for improvement. Your goals should be SMART: specific, measurable, achievable, relevant and time-bound. With this KPI, you can see if your agency is on track to meet its strategic objectives. To provide insight to your performance, you should regularly review each goal and completion. It is to ensure that your agency’s daily activities align with your long-term vision, keeping your team-motivated and driving consistent progress.


