


How to Build Client-Centric Reports That Drive Retention
Creating a report that clients value isn’t just about delivering numbers or data; it’s about telling a story that aligns with their goals, enhances customer experience, and demonstrates how you can help them succeed.
By creating and delivering reports tailored to each client’s needs, you show that your top priorities are their success and the effectiveness of their marketing efforts. This guide will walk you through five essential steps to building client-centric reports.
We’ll focus on clear, actionable insights that clients can rely on. Whether selecting the right metrics or adding personalized insights, these tips will help you create reports that inform and engage your clients.
Step 1: Identify Client Goals and Key Metrics
The foundation of any effective client report starts with understanding your client’s unique goals and pain points. An initial brainstorming session is essential to gain insights into their business strategy, objectives, and preferences. This conversation should go beyond metrics and KPIs, focusing on a personalized experience that aligns with the client’s specific needs, whether it’s to improve brand awareness, generate leads, or boost sales growth.
A solid understanding of these goals enables you to recommend and track the metrics that matter most to their success. With their insights, conducting some market research or talking directly to their clients could also be beneficial in revealing underlying challenges or opportunities they may face. This approach helps address the unique needs of each new customer and aligns reporting efforts with their goals to benefit the bottom line.
Here are a few examples of key metrics aligned with common client goals, although they vary for your clients.
Conversion Rate
This metric shows the percentage of website visitors who complete a desired action (like signing up or purchasing). For instance, a client aiming to increase lead generation might track form submission conversions from targeted landing pages.
Return on Investment (ROI)
Measuring the revenue generated against the marketing spend provides insight into overall campaign profitability. For a client running PPC campaigns, tracking ROI for each campaign can reveal which keywords or audiences yield the highest return.
Audience Engagement
This metric measures interactions on social media or content, such as likes, comments, shares, and time spent on the page. If a client wants to improve brand awareness, tracking engagement on social media posts can help refine their messaging to resonate better with their target demographic.
Customer Lifetime Value (CLV)
For clients focused on long-term business growth, CLV is key to understanding the average revenue generated per customer over their entire relationship with the brand. A retail client, for example, may use CLV to measure the impact of loyalty programs on recurring purchases.
Cost Per Acquisition (CPA)
CPA provides insight into how much is spent on acquiring a single customer. Lowering the CPA can be critical for clients focused on growth but with tight budgets. For instance, an eCommerce client could track CPA across different ad channels to optimize ad spend allocation.
By identifying these specific metrics and aligning them with client goals, you can provide a roadmap that tracks performance and enhances the client’s ability to make better, data-driven decisions that support their business objectives.
Step 2: Choose the Right Reporting Template
Selecting the right reporting template is crucial for creating reports that resonate with each client. Different industries have unique data priorities—eCommerce, PPC, and social media-focused clients each need tailored insights that reflect their specific objectives and customer data. Using templates designed for various client types helps you present information that speaks directly to their needs and aligns with their target audience.
You can also choose to create a report from scratch, only adding your client’s most crucial KPIs or mixing and matching data from different sources to present something very personalized to each client and their objectives. While this can be more time-consuming and sometimes overwhelming, your clients will most likely appreciate their report’s level of detail and personalization.
We suggest a hybrid approach: select a template that closely matches your client’s branding and customize it further. With tools like DashThis, you can effortlessly adjust KPIs, insert comment boxes, incorporate logos, change colors, and more. DashThis offers various reporting templates that streamline the reporting process while ensuring visual cohesion across client presentations. Here’s an overview of some of DashThis’s template options:
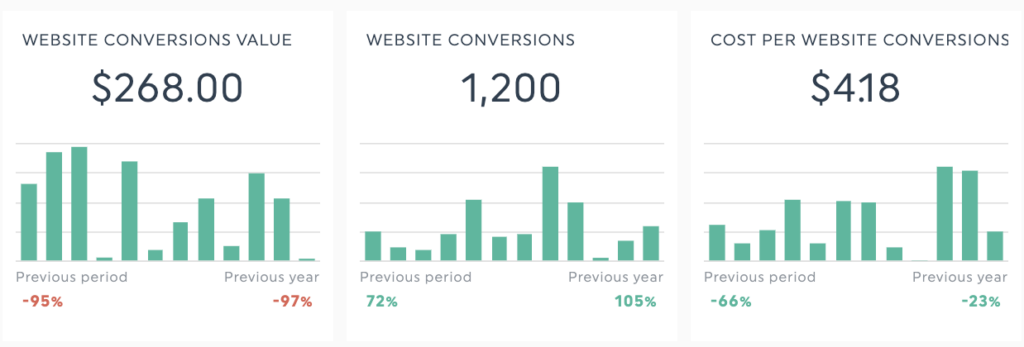
eCommerce Template
Designed to highlight key metrics like sales, return on ad spend, and cost per acquisition, this template focuses on customer needs for real-time insights into purchasing behavior, income, and campaign success. For example, an eCommerce brand can use this template to monitor its online marketing campaigns, tracking which product categories or promotions drive the most revenue.
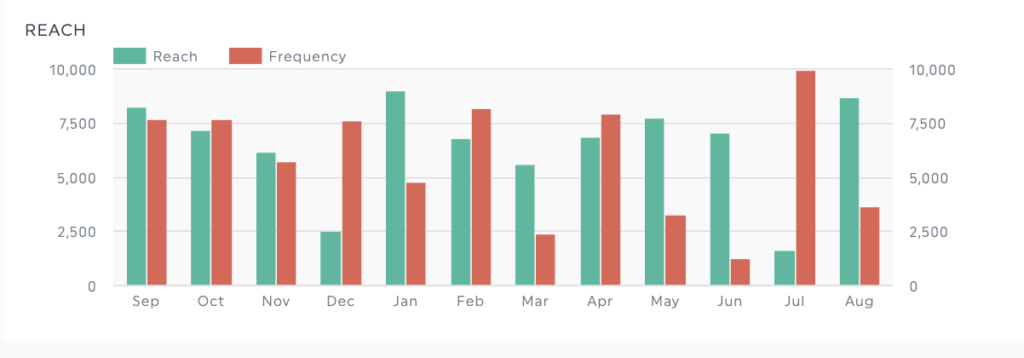
Social Media Template
This template tracks audience growth, engagement rates, and reach, delivering insights into what content resonates best with their target audience. Social media managers can quickly see how their latest posts perform and adjust content strategies to align with audience preferences.
Digital Marketing report template
Track your digital marketing efforts in one easy-to-understand marketing report, letting you track organic website traffic, email marketing campaigns, PPC results, and social media presence in one spot.
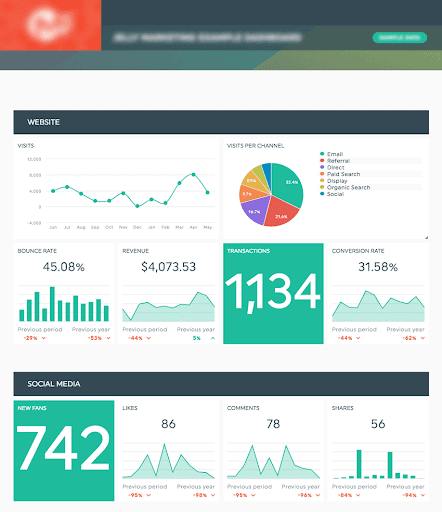
Step 3: Customize Visuals and Data Presentation for Clarity
Customizing visuals and data presentation is key to meeting customer expectations and enhancing the user experience. The right visuals can make complex data more accessible to interpret, allowing clients to quickly grasp the most essential insights without feeling overwhelmed. Choosing elements that highlight key metrics and enhance readability is essential when customizing charts, color schemes, and layouts.
Start by selecting chart types that best represent each data point. For example, line charts are ideal for showing trends over time, while bar charts are effective for comparing categories, like performance across different marketing campaigns. Color schemes are equally significant—use contrasting colors to highlight key takeaways or critical data points, and stick to a consistent palette that reflects the client’s brand identity, making the report professional and visually engaging.
Layouts should also prioritize clarity. Arrange sections logically, leading clients from an overview of performance metrics to more detailed insights. Simplified visuals make it easier for clients to understand the story behind the data, emphasizing the insights that matter most and reducing unnecessary details.
Step 4: Add Context with Annotations and Explanations
Adding context to your reports with comments and explanations can significantly boost customer satisfaction by helping clients understand the “why” behind the numbers. Narrative elements, such as annotations on charts or summaries, provide valuable touchpoints that give clients insight into data trends, sudden spikes, or unusual drops in performance.
DashThis’s comment boxes and summary sections are ideal for providing this context. For instance, if a sudden spike in engagement correlates with a new campaign, adding a quick note explaining this link allows clients to see the impact of their marketing efforts at a glance. These summaries also make tracking customer feedback easier and align reporting with client expectations, especially for loyal customers with unique needs.
Step 5: Regularly Update and Review Reports with Clients
Consistently scheduled reporting is essential for maintaining transparency and fostering trust with clients. Regularly updating and reviewing reports provides clients with a positive experience and positions your agency as a partner invested in their long-term success. Regular touchpoints ensure that clients are always informed of progress and any necessary adjustments, enhancing customer interactions’ effectiveness and ensuring they feel supported at every step.
DashThis’s automated reporting tool can be a significant differentiator here. Automation enables agencies to deliver real-time insights without adding manual work, ensuring reports are always fresh and up-to-date. With automated data refreshes and customized report delivery, clients get consistent, accurate performance snapshots, strengthening the relationship and demonstrating your commitment to helping them reach their goals.
Client-centric reporting is vital to building trust and ensuring long-term client retention. Creating reports prioritizing what matters most to clients shows you’re invested in their success. Start exploring DashThis to elevate your reporting process and create lasting partnerships that grow with your client’s success.