Growing Revenue Using Sales Interactions
The first step to business growth is understanding its current state. In order for a company to grow, it needs to know what they are currently doing and why their product or service matters.
The Growth Mapping framework allows businesses the opportunity to not only understand themselves better but also identify new opportunities that will help them reach their goals. This is done by asking hard questions about every aspect of an organization, from the big picture down to smaller interactions with prospects who may one day turn into customers.
This is done by asking hard questions about every aspect of an organization, from the big picture down to smaller interactions with prospects who may one day turn into customers.
This outlook is the catalyst for building a clear and detailed business profile.
In this post, we give you a sneak peek into one of the most important exercises: Growing Revenue using Sales Interactions.
Here’s what you can expect to learn;
- Why mapping your sales process is vital
- How to break down key sales interactions
- How to identify opportunities or weaknesses in your pipeline
PLUS at the bottom of this blog post, there’s a workbook download and video walkthrough that’ll make it even easier for you.
Ready? Let’s go!
Defining Your Sales Pipeline
Start by looking at your own sales process in more detail. What are the key interactions in your sales process? How do you know if they’re working well? What should be done to optimize them? These are all questions that need answers.
The first step is defining these key interactions, then reviewing and optimizing them to increase revenue for your business.
This exercise will help you explore the customer journey from the first contact to paying customers. You’ll start with a prospect’s first point of interaction, and then follow their progress through your sales funnel until they become a client.
Key Exercise: Mapping & Measuring Your Sales Pipeline
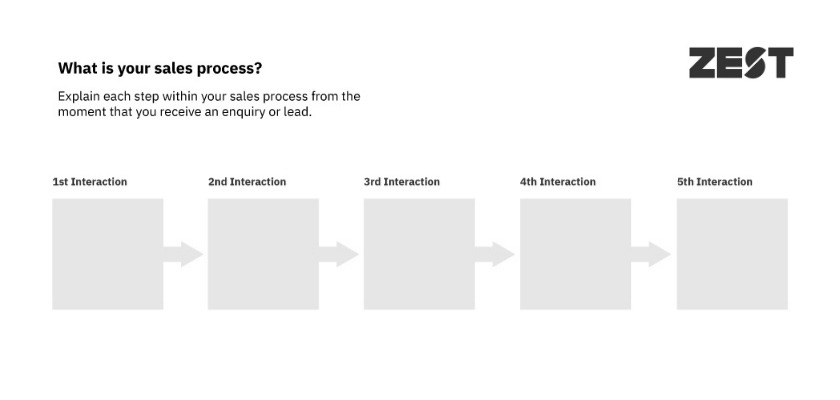
In each stage of the pipeline, you’re trying to qualify a prospect before moving on. A qualification call is usually first; it’s where you determine whether they can meet your needs and if so, move onto another interaction with them. The next step could be either meeting in person or giving them an online demo depending on what type of business this is for.
Throughout every stage, we’re trying to understand the prospects’ needs, as well as help gauge their interest level by looking at things like budget scope and timeframes.
The third interaction could be a presentation, the fourth could be a quote, and the fifth could be a video.
Once you’ve mapped out your sales journey in these steps, it’s time for some math on how well they are working for you…
Example Exercise
Measuring the Performance of Your Sales Funnel
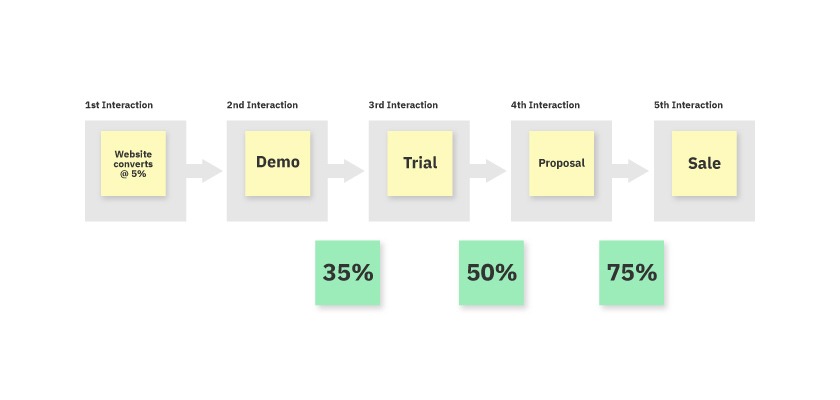
In this example, you’ll see how 5% of website visitors are converted to inquiries. Let’s suppose that over the year your company receives 12,000 web visitors, which converts into 600 leads.
Following qualification calls, 25% convert to site surveys or other interactions which give us an in-depth look at their needs.
Out of the 150 site surveys generated, 50% would like to receive a quote, and out of the 75 quotes issued, roughly half are closed as sales, resulting in 37 paying customers from the original 600 leads coming in.
The data that can be gathered on the back of these interactions will give you a benchmark for your business, and allows you to pinpoint any weaknesses and opportunities in your sales pipeline.
Improving the Performance of Your Sales Funnel
You can see how doubling your web traffic could increase leads, but it also takes time and money. Maintaining the same number of visitors to your website while increasing conversion rates from 2% – 3%, for example, might be a better investment because you don’t need any more marketing budget or resources than before.
In this particular example, that could mean finding ways to improve conversion rates following site surveys (perhaps by tweaking the message or content). Maintain a 50% close rate with the next interactions and you’ll see 37 paying customers increase to 52 – by focusing on just one area of your funnel you can create dramatic increases.
One way to increase your revenue is by enhancing or refining your key sales interactions. Once you’ve converted visitors to the website, you’ll be able to do so much more for the company’s growth goals and success than just what the visitor can see online.
This exercise can help you realize that the buck doesn’t stop with your website – once you’ve converted your customers from browsing to buying, there are many opportunities out there waiting for those who want an edge over other competitors.
The Growth Mapper framework has been designed to help you understand the opportunities and challenges of your business growth. We start with fundamentals like understanding where your company stands now, looking at obstacles that have or are impeding progress in key areas such as targeting, messaging & channels, before going into more detail on how best to move forward based on what we find during the workshop.
Ready to start mapping your business growth? Download the free Profiling workbook and get started today.
Watch the video walkthrough to help you get started!

