


How to Calculate, Track, Analyze, and Report on Conversion Rates
Today, we’re sharing how consistent and accurate conversion rate tracking, analysis, and reporting will transform your customer retention rate and help your agency to scale.
You’ve landed a brand new client, launched a PPC campaign, and continuously checked back in on results… only to find a worrisome trend: their ROI isn’t hitting the mark.
You dive into your campaign dashboard to try and figure out the problem. Starting on opposite ends of the funnel, you dig into the numbers. The audience looks good and impressions are strong.
Ah-ha. There’s the culprit. There’s a noticeable dip in the funnel when it comes to PPC ad clicks. The leads just aren’t converting, so that’s lowering campaign ROI. Prospects are getting lost on the other side of the wall.
After some quick A/B testing, you tweak the messaging and the CTA in the ads. Over the next few days, the numbers start trending upward again as more new customers click on the ads, leading them to the campaign landing page.
That’s the power of conversion. Getting customers to take that leap to drive campaign success one click at a time. And for marketing agencies, conversions are the magic ingredient that will cause new clients to sign on for the long-term.
Let’s dive in.
In this article:
- What Is Conversion Rate?
- Why Is Tracking Conversion Rates Important for Agencies?
- How To Track Conversion Rates
- How To Calculate Conversion Rate
- 12 Key Conversion Metrics To Measure Campaign Success
- Summary & Key Takeaways
What is Conversion Rate?
A conversion is a consumer action that moves a visitor towards fulfilling a business’ sales or marketing goal. And the conversion rate is simply the percentage of visitors completing the desired action.
Common conversion goals include:
- Making a purchase on an ecommerce site or adding an item to cart.
- Engaging with a website (e.g., time spent on page or number of landing page visitors).
- Signing up for a newsletter or creating an account.
- Downloading an asset such as an eBook or guide.
- Clicking on an ad in Google search results.
- Capturing leads through forms, chat or calendar bookings.
Micro and Macro Conversions
A potential customer may complete numerous actions in a single visit, so it’s helpful to break these actions down into macro conversions and their component micro conversions. A macro conversion is your client’s primary goal—whether that’s selling a product or funneling calls to their sales department. A micro conversion is a smaller step that leads down the road to that main action. In these examples, it could be adding a product to their cart or requesting a quote.
Choosing what specific macro and micro conversions to track really depends on the nature of your client’s business and the campaign. Choosing the most relevant goals for a PPC campaign will look very different from a social media awareness campaign. Overall, apply conversion tracking to any campaign that involves clickable links.
Why is Tracking Conversion Rates Important for Agencies?
There are countless metrics that agencies should be tracking for clients. But among them, conversion rate stands out as a shining north star. Here’s why:
Prove You’re Delivering on ROI
Tracking conversion rates demonstrates that not only are you reaching your client’s target audience, but that your campaigns are generating results to grow their business. It puts quantifiable numbers to the success of your work.
Determine Relevant Budget Allocation
Direct funds to the most effective streams by comparing conversion rates across channels to identify the highest-performing strategies.
Identify Improvement Opportunities
Comparing more successful campaigns with lower converting ones yields repeatable growth strategies and targeted improvements to proactively present to clients, to position your agency as their go-to expert and problem-solver.
How to Track Conversion Rates
When it comes to client satisfaction, it’s not enough to check in on results here and there, inconsistently. The key to optimization and success is continuously monitoring results in real time. So–how is that done? Let’s take a look.
Defining Conversion Goals
As discussed earlier, the first step is to define what a conversion means for your client—whether that’s generating leads, completed sales, or growing an email newsletter list.
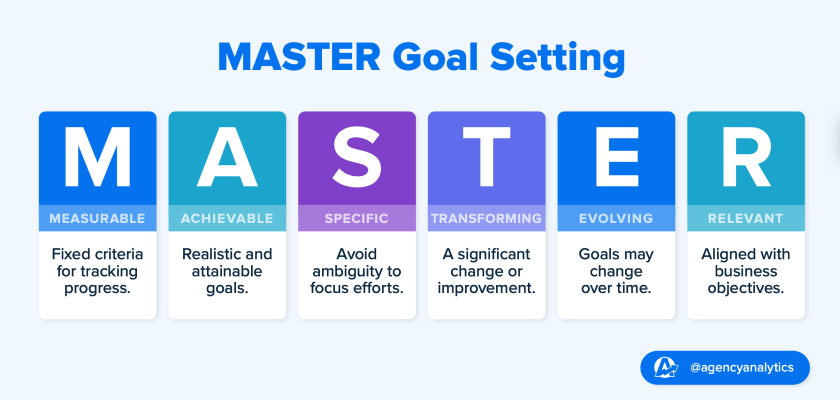
A great way to establish clear conversion goals that are tailored to your client’s needs is by using the MASTER framework. The MASTER acronym stands for Measurable, Achievable, Specific, Transforming, Evolving, and Relevant.
It’s a flexible and adaptable way to track primary and secondary conversion goals across campaigns, providing a clear roadmap to achieve objectives and enhance team communication.
Locating Conversion Data Sources
Next, measure conversion data using the digital platforms relevant to the goal. This might include:
- Call Tracking Metrics for inbound phone calls.
- Mailchimp for email subscribers.
- Google Ads for PPC campaigns.
- Shopify for ecommerce sales.
Because many conversion metrics measure results at a channel or source level, the raw information should be segmented or filtered to hone in on the selected reporting metrics.
Some common segmentations are:
- By conversion type
- By source or channel
- By page, action or event in a session
- By campaign
The bad news is that manually compiling data from multiple sources is time-consuming and prone to errors. The solution? AgencyAnalytics.

Connect with clients’ conversion data and compile insights from more than 80 marketing integrations in 11 seconds flat, using the Smart Reports feature. Build your first report today by signing up AgencyAnalytics for a free 14-day trial.
By working with a solution like AgencyAnalytics, your agency will consistently monitor key data points, and even automate reporting to streamline workflows… but more on this later.
How to Calculate Conversion Rate
Regardless of what specific conversion metric you’re calculating, the basic formula for how to calculate a conversion rate is the same. Take the total number of people who interacted with a piece of content (like an ad, website or email) and divide it by the number of conversions.
Conversion Rate Formula

Conversion Rate Calculation Example
Let’s say we want to calculate the click-through rate for a PPC campaign. 1,200 people saw the ad, and 60 clicked through to the landing page. Plugging the data into the conversion rate formula:
(60 conversions/1,200 impressions)*100= 5%
In this example, the measured conversion rate is 5% of individuals who were served the ad, converted.
12 Key Conversion Metrics to Measure Campaign Success
Tracking conversions goes beyond simply identifying the overall rate–to really gain insight into how your clients will best meet their goals, it’s critical to break this metric down into further, more granular insights. Let’s dive into some of the most important individual conversion metrics.
1. Click-Through Rate (CTR)
One of the most basic conversion metrics is click-through rate (CTR), which measures how many people click on a website link, email, or ad. More specifically, it compares the number of clicks to impressions.
Click-through rate is an important metric for measuring the effectiveness of email, display, social and paid media campaigns. Using click-through rates, agencies compare how many people saw an Instagram ad, versus how many clicked through to the product page or how many consumers opened a promo email and then proceeded to click the CTA button.
Improving CTR is a simple way to improve your clients’ sales pipeline and determine how well off-site marketing is at pulling in traffic.
2. Cost per Conversion (CPC)
Cost per conversion (CPC) is a real-time signpost to measure how well marketing spend is converting into desired actions. It’s a marketing metric that evaluates the cost of acquiring a single conversion, such as download, lead or sale from a marketing campaign.
To calculate the cost per conversion, divide the total cost expended in an advertising campaign by the number of conversions generated during that time. The result tells you the price tag associated with each conversion.
By analyzing this metric, you’re measuring the profitability of campaigns and will make informed decisions about the cost-effectiveness of competing strategies and budget allocation. Identifying which channels or campaigns are performing at the top of their class allows you to maximize clients’ return on investment, shifting budget spending to focus on optimizing conversion rates.
Tracking cost per conversion over time assesses the impact of conversion optimization efforts and a trending lower cost means improving marketing efficiency.
3. Return on Investment (ROI)
To determine the profitability of a campaign, marketers look at the return on investment (ROI). To calculate simple ROI, take the revenue generated and subtract the amount spent on the campaign.
A positive ROI (ideally, the higher the better) is your goal, indicating you’re bringing in more in sales than is being spent on advertising. A negative number means the campaign resulted in more losses than gains, and should be paused or adapted.
ROI is often measured according to attribution, either direct (last marketing touch before a sale) or indirect (attributed evenly across all touches). It should also include all the costs associated with marketing, including creative development, media spending, and customer-facing staff time.
4. New Visitor Conversion Rate
New visitor conversion rate hones in on the behavior of new traffic to your site, measuring the percentage of first-time visitors who make a purchase or complete the desired conversion activity. A high new visitor conversion rate indicates a website is successfully engaging and converting visitors into customers, while a low new visitor conversion rate hints that purchasing barriers should be smoothed out.
5. Returning Visitor Conversion Rate
The partner metric for new visitor conversion is the returning visitor conversion rate. This metric examines the conversion rate of repeat website visitors. Because of their previous exposure to the brand and demonstrated interest, a website’s conversion rate for returning visitors should be higher than for new visitors, especially regarding purchases.
If for some reason the metric is as low as the new visitor rate, this signifies a problem with the sales funnel. Separating the two metrics gives your agency a more accurate understanding of the true conversion rate, especially since new visitors often skew the number downwards.
6. Average Time on Site
Another top metric to track is the average time on site, predominantly calculated by Google Analytics as the time between hits (or data requests on a website). How long a user stays active on a site, together with the conversion rate, indicates how quickly and efficiently people are converting.
- A high conversion rate paired with a low average time on site means things are great and enough information is provided to convert users.
- A high conversion rate and a high time on site mean that visitors are captivated, spending more than the usual amount of time engaging with content before converting, or that the decision to act requires more research.
- If both are low, that’s bad news. Users are leaving immediately without converting and adjustments need to be made to keep users on the site.
7. Bounce Rate
To understand how well a website or app attracts and retains users, examine the bounce rate. This metric is the percentage of unengaged sessions that begin and end on the same page. An unengaged session lasts less than 10 seconds and doesn’t trigger a conversion event, meaning a user arrives on the page and then immediately exits the browser because they’re either uninterested or couldn’t find what they were looking for.
A good bounce rate is 40% or lower, while a rate of 60% or higher is a sign that you may need to evaluate site content to make it more engaging.
8. Order Confirmation
As the last stage of the ecommerce sales funnel, this conversion metric indicates how effectively customers are guided through their purchasing journey. A low order confirmation rate means there could be user experience or checkout problems.
Monitoring user flow through product description pages, payment and shipping information prior to order confirmation will reveal where customers are dropping off. This data can then be used for conversion rate optimization.
9. Revenue per Visitor
This metric calculates the average amount of revenue generated per site visitor over a selected timeframe. Revenue per visitor (RPV) is increased either by improving the sales conversion rate or by increasing the average purchase amount per customer. RPV is a straightforward way to measure how well sales growth and conversion efforts are working.
10. Cost per Acquisition
Cost per acquisition (CPA) is how much it costs to acquire a lead or customer. Distinct from customer acquisition costs, CPA focuses on acquisition costs per channel or campaign rather than the average cost across all channels. It’s calculated by taking the total advertising spend and dividing it by the number of generated acquisitions.
Not only is it a conversion metric, but it’s also a pricing model used by Google and others in online advertising. It’s preferred by some agencies because they determine their goal before launching a campaign and the client pays only when a conversion happens—like sales or form submissions. This may prevent overspending on irrelevant leads. Cost per acquisition is an important metric to determine advertising campaign efficiency and content engagement.
11. Average Order Value
Considered one of the most important metrics in ecommerce, average order value (AOV) examines the average amount spent by customers per transaction. It’s calculated by dividing total revenue by the number of orders. Because of the variability and competitiveness of online sales, AOV should be assessed monthly, or in some cases weekly to properly benchmark associated marketing spend and product pricing.
12. Cart Abandonment Rate
Today, on average two-thirds of all digital shopping carts are abandoned due to reasons ranging from user friction to site performance or simply window shopping. The cart abandonment rate metric helps marketers understand user behavior as it monitors the percentage of people adding items to their cart, but leaving the website or app without completing their transaction.
After determining the likely reason for cart abandonment, it’s possible to create solutions to drive up conversion rates, like average order value and order confirmation. A high rate of cart abandonment might indicate that resources are allocated towards inflated customer acquisition costs that fail to translate into actual purchases.
Summary & Key Takeaways
You’re not just throwing KPIs at the wall and seeing what sticks. Achieving strong conversion rate tracking, and optimization of core conversion metrics is vital for agencies to demonstrate ROI and drive client success.
Take advantage of AgencyAnalytics’ automated dashboards and template builders to:
- Automate reports and keep clients up-to-date and engaged with campaign progress.
- Visualize conversion data with attractive, comprehensive graphs and charts to improve customer understanding and decision-making.
- Bring together insights from campaigns or A/B tests for easy side-by-side comparisons.
- Leverage templates to build white labeled reports complete with your agency branding for scalable reporting that wins back billable hours.
Most clients want to know their conversion rate. This process doesn’t need to be painstakingly long. With AgencyAnalytics, you can track, report, and analyze key conversion metrics in no time.