


10+ SEO Reporting Essential Metrics to Track
If you’re a beginner marketer, SEO professional, or business owner wanting to understand SEO reporting, you’re in the right place.
This article will cover the key metrics to track and share practical tips on communicating your SEO successes.
By the end of this article, you’ll have a better understanding of:
- The significance of SEO reporting
- Essential metrics to track SEO success
- How to create informative SEO dashboards using Dashthis
- Strategies for presenting your SEO wins to stakeholders
- Ways to streamline your reporting process through automation
Let’s dive in!
The Importance of SEO Reporting
First, let’s discuss why SEO reporting is crucial for your business. Imagine you’ve spent countless hours optimizing your website and building quality backlinks. But how can you demonstrate the impact of your efforts to your team or clients?
This is where SEO reporting comes into play. Measuring SEO KPIs is important for several reasons:
- Assessing SEO Success: SEO KPIs provide data to determine the effectiveness of your strategies. These metrics show if your website improves its search engine visibility, drives organic traffic, and meets its goals.
- Informed Decision Making: Marketers gain valuable insights into their website’s performance by tracking SEO KPIs. This data helps guide and prioritize strategic decisions.
- Competitive Benchmarking: SEO KPIs help businesses compare their performance to competitors and past results. This comparison identifies areas for improvement and reveals opportunities to stay competitive.
Key Metrics to Track for SEO Success
You can track countless metrics, each offering insights into your website’s performance. However, trying to monitor every single metric can be overwhelming.
It’s important to focus on the key metrics that affect your SEO goals and rankings. Knowing how these metrics impact the algorithm can help you improve your digital marketing strategy and SEO campaign.
Now that you understand the importance of SEO reporting let’s discuss the key metrics you should focus on. Here are ten essential ones:
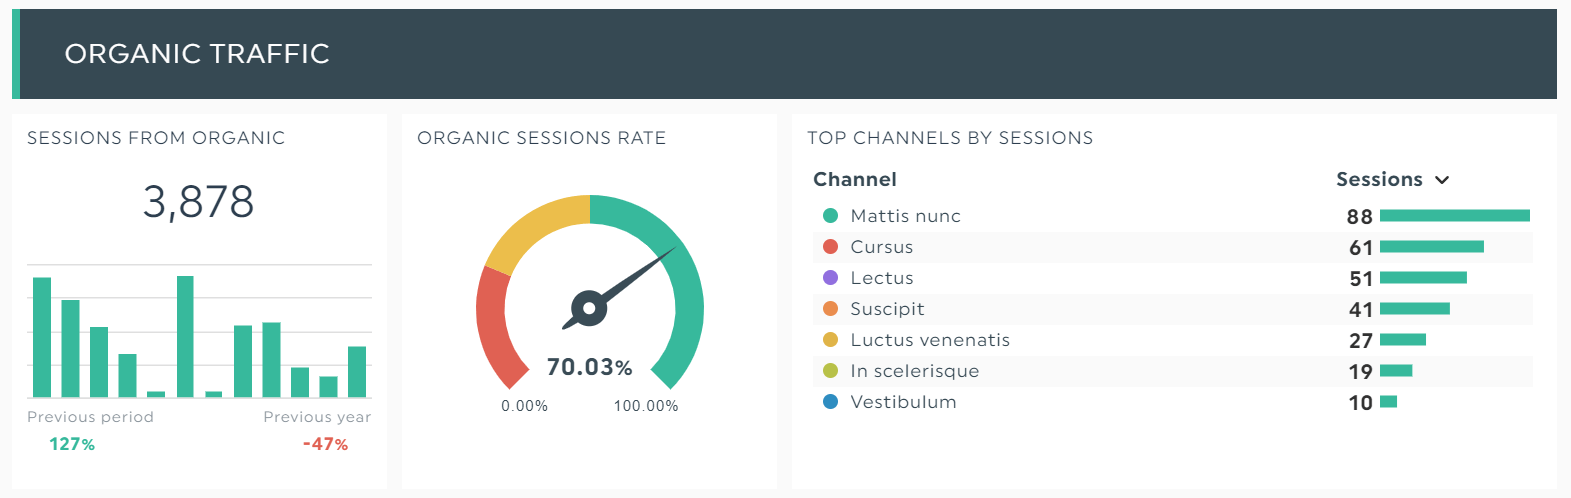
1. Organic Traffic Growth
Organic traffic refers to the total number of visitors landing on your website through unpaid search results. Measuring its growth over time is critical to assessing your SEO performance. Tools like Google Analytics make tracking this metric easy.
Tracking organic traffic growth is crucial. It shows how effective your SEO efforts are and reflects website health. This metric shows how visible your site is in searches. It helps you see the impact of your keyword research, search intent, and optimization strategies. If the trend increases, it means better website traffic and audience reach. If it goes down, it could mean SEO problems or more competition.
2. Keyword Rankings
Monitoring your keyword rankings is essential to determining your website’s performance for specific searches. You can find ways to improve and measure your progress by tracking your ranking positions for target keywords. Tools like SEMrush and Ahrefs provide detailed keyword ranking insights.
3. Backlink Quality and Quantity
Backlinks are crucial in SEO because they signal to search engines that other websites trust your content. Monitoring the quality and number of backlinks and referring domains is essential. Effective link-building helps you get these valuable links. Use tools like Moz or Majestic to analyze your backlink profile and ensure your links come from reputable sources.
4. Conversion Rates
Attracting visitors to your website is an important aspect of digital marketing. However, more than simply bringing people to your site is required. Monitoring how well those visitors engage with your content and take desired actions.
Track organic conversions to see how your SEO efforts reach your target audience. For example, you can set up conversion tracking in GA to measure the effectiveness of your SEO efforts.
5. Page Load Speed
Page load speed is a critical factor for both user experience and SEO. Slow-loading pages can frustrate visitors and negatively impact your search engine rankings. Core Web Vitals also play an important role in this. Use tools like Google PageSpeed Insights to check your page load times and Core Web Vitals. You’ll also get recommendations for improvement.
6. Bounce Rate
Bounce rate is the percentage of visitors who leave your website after viewing only one page. A high bounce rate may mean your content needs to meet users’ expectations or your website has usability issues. Monitor your bounce rate in Google Analytics and improve user engagement and relevance.
7. Click-Through Rate (CTR)
Click-through rate (CTR) measures the percentage of users who click on your website’s listing in search results. A higher CTR indicates that your title tags and meta descriptions are compelling and relevant to users’ searches.
To get started, track your CTR in Google Search Console. This tool provides data on how often users click on your links when they appear in search results.
If you notice a lower CTR, it might be time to optimize your snippets. This involves improving your title tags and meta descriptions to make them more attractive and relevant to users. Doing this can increase your visibility in search results and attract more organic clicks to your website.
8. Domain Authority (DA)
Domain Authority is a metric developed by Moz that predicts how well a website will rank in SERPS. It considers various factors, including the quantity and quality of backlinks. Monitor your DA using Moz’s tools and work on building high-quality links to improve your website’s authority.
9. Average Session Duration
Average session duration measures users’ time on your website during a single visit. Longer session durations often indicate that users find your content engaging and valuable. Track this metric in GA and aim to create compelling content that keeps users on your site longer.
10. Pages per Session
Pages per session represent the average number of pages viewed by a user during a single visit to your website. A higher number of pages per session suggests that users are exploring more of your content and finding it relevant.
Three tracking tools to help track your SEO progress
1. Google Analytics / Google Search Console (GSC)
Google Analytics is the first free tool Google offers for analyzing website performance. It helps you understand visitor data and track user traffic by page, channel, or campaign.
Google Search Console, on the other hand, is a free tool that evaluates search performance and enables you to optimize your website content. It shows which search queries bring users to your site, the keywords you rank for, and the devices people use to find it.
Cost: Free
2. Moz / Ahrefs /SEMRush
These paid SEO tools can help you check and improve the following:
- SEO Audits: Identify issues with your site’s SEO and provide recommendations for improvement.
- Keyword Rank Tracking: Monitor the rankings of your target keywords over time.
- Backlink Analysis: Track the backlinks to your site and analyze their quality.
- Technical SEO Optimization: Ensure your site meets technical SEO best practices.
- Content Optimization: Help improve your content to rank better in search results.
- Competitor Analysis: Compare your SEO performance with that of your competitors.
Some popular options include Ahrefs, SEMrush, and Moz.
Cost: Paid from USD 99
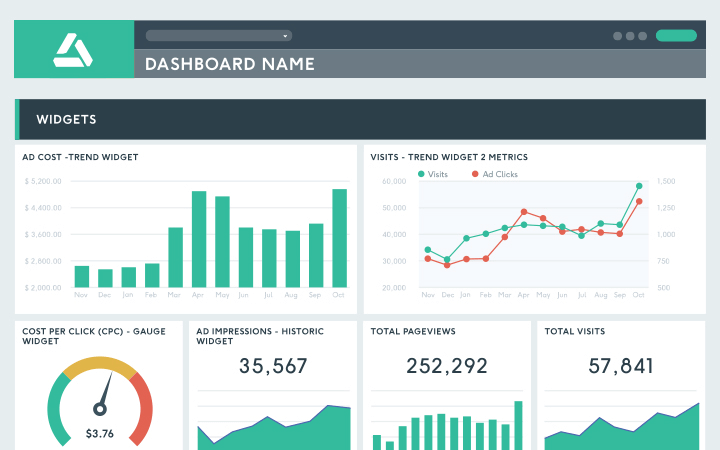
3. Dashthis
With a tool like Dashthis, you can create custom SEO dashboards. These dashboards combine data from various sources, making monitoring your performance easier.
Here’s how to get started:
- Sign in to your Dashthis account or create a new one if you haven’t already done so.
- Once logged in, click the “New Dashboard” button to create a new dashboard.
- Choose a template or start with a blank canvas, depending on your preference. Dashthis offers various pre-designed templates that you can customize to suit your SEO KPI reporting needs.
- Select the SEO data source you want to connect to, such as GA4, Moz, Ahrefs or any other marketing tool you use to track your results. Then, add preset widgets or your most important SEO metrics and dimensions.
- Finally, choose the sharing options for your report. You can generate a unique URL to share the report or schedule automated report deliveries via email.
Having all your SEO data in one place allows you to identify trends, spot issues, and report on your progress.
How to efficiently communicate SEO reporting metrics
Once you have your metrics tracked and dashboards set up, it’s time to share your SEO successes. But it’s essential to communicate well when sharing information with others, like your boss, coworkers, or clients. Here are some tips to help you do that:
1. Tailor Your Reports to the Audience
Remember that different audiences have different needs and preferences when presenting your reports. For example, a CEO might want a big-picture overview with critical metrics and trends to understand how the company is performing. They likely won’t need all the details, just the highlights.
Conversely, a marketing manager may want more in-depth information. They might be interested in specific campaign performance or detailed user behavior to help optimize their strategies.
Adapt your reporting style to ensure your message speaks to your audience. For the CEO, use simple charts, precise visuals, and concise summaries. For the marketing manager, provide detailed breakdowns, comprehensive data, and actionable insights.
2. Provide Context and Actionable Insights
When presenting data, don’t simply show the numbers; you must help your stakeholders understand what they mean. Explain why specific engagement metrics are important and what they show about performance. Highlight key trends, like traffic increases or user engagement drops during certain periods. This makes the data more meaningful.
Also, offer actionable recommendations based on your findings. For instance, if you see a spike in traffic from social media, consider investing more in that channel. If you notice lower revenue on your e-commerce landing pages, consider optimizing the checkout process or improving the product descriptions.
Providing context and insights helps your audience grasp the significance of the data and understand what steps to take next.
3. Utilize Visualizations Effectively
When sharing SEO data, use pictures like charts and graphs to make it more interesting and easier to understand. For example, you can use a line graph to show how traffic has changed. You can also use a pie chart to show where your traffic is coming from, like search engines or social media.
Based on your data, choose the right type of visualization. Make sure your visuals are clear and straightforward to interpret. This will help your audience quickly grasp the information and see what’s important.
4. Emphasize Business Impact
Ultimately, stakeholders want to see how your SEO efforts impact the company’s bottom line. Link your SEO metrics to business goals like revenue growth, lead generation, or customer acquisition.
Showcase success stories and case studies to show the real-world impact of your work. For instance, highlight how improved search rankings led to higher sales or how optimizing content resulted in more leads.

Streamlining Your Reporting Process
Creating SEO reports can be time-consuming, but automation can help streamline the process. With Dashthis, you can set up your dashboards to update data and send reports to stakeholders.
Here’s how:
- Set up your dashboards to update your data regularly. This way, you’ll always see the newest data about your website’s performance in search results.
- Schedule report delivery to stakeholders at your desired frequency (e.g., weekly, monthly)
Let’s recap the main points we’ve covered:
- SEO reporting is important to show your work’s value and identify areas for improvement.
- Focus on tracking your most crucial KPIs.
- Use Dashthis to create informative SEO dashboards that merge your data in one place.
- Tailor your reports to your audience. Provide context and actionable insights. Use visualizations effectively and emphasize business impact.
- Streamline your reporting process through automation to save time and keep stakeholders informed.
Now, it’s time to put these insights into practice. Start tracking your SEO metrics, creating dashboards, and communicating your successes to stakeholders. With dedication and the right approach, you can take your SEO reporting to the next level! Try Dashthis for free today!