
5 SEO Report Templates to Measure the Progress of Your SEO Efforts
Can you tell your clients what search engine optimization (SEO) is worth or how existing SEO efforts are going?
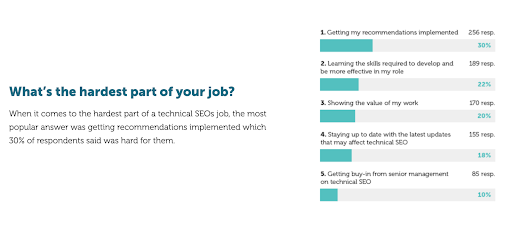
If you’ve struggled with communicating progress, you’re not alone. According to a report from Aira on technical SEO, 20% of respondents say showing the value of their work is the hardest part of the job.
Here’s where SEO reports come in handy to prove the value of your work to clients. We’ve compiled some practical tips and templates to create an SEO report that builds trust, influences stakeholders, and keeps customers.
What is an SEO analysis report?
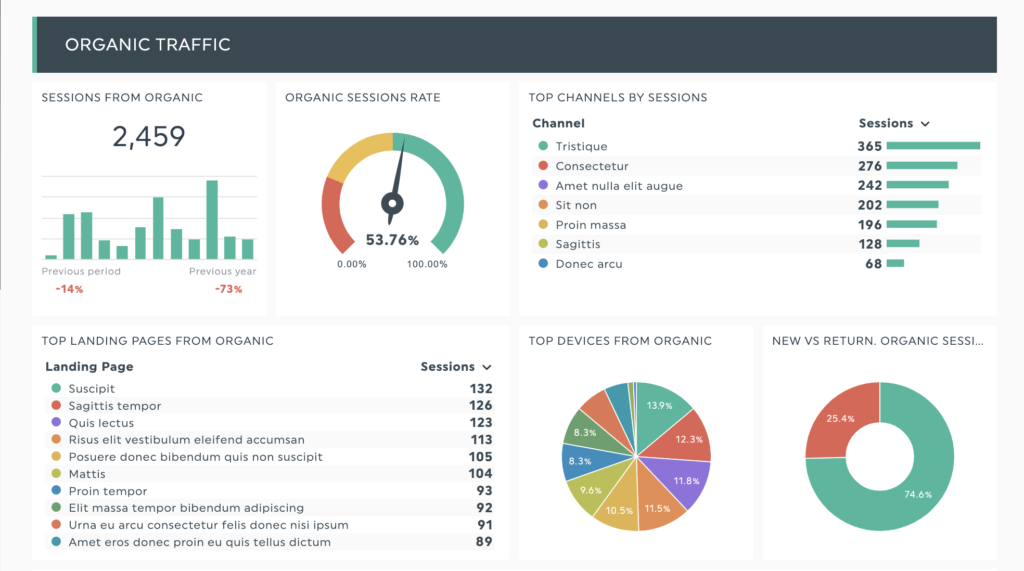
SEO analysis reports let you track all activities like keyword rankings, organic search traffic, and link-building progress across tools in one dashboard. They communicate the effectiveness of your SEO agency’s work to your clients.
Besides presenting critical metrics in a visually-pleasing manner, these reports offer your clients with:
- Analysis: It explains what key metrics mean and the progress made compared to the previous month.
- Recommendations: What are the next steps for your client? What should they avoid doing? Personalize these recommendations to the client’s unique business objectives and campaign goals.
How an SEO Report Template Helps Build Confidence with Your Clients
They help show the value of SEO to clients
Not all SEO metrics are relevant to your client.
A well-structured SEO report template focuses on the metrics and KPIs important to the client, highlights vital activities, and prevents overwhelming readers.
It understands which goals the reader holds as essential and presents only the necessary information. You can also show how metrics compare between reporting cycles (weekly or monthly) to show an increase or decrease over time.
Consider your audience when deciding what to include in your report. Sending a campaign performance report to a marketing lead? Include operational metrics for your pay-per-click (PPC) campaigns alongside your SEO metrics.
If you know the head of sales will read your report, focus on how many sales leads arrived from your organic channels or include the revenue contribution from organic traffic.
Shows transparency and builds trust with your client
Your immediate clients aren’t the only ones who read the reports you send.
They’re forwarded to other departments as reference material or sent to management as part of investor reporting, quarterly business reviews, or SEO strategy planning sessions.
Hence, the quality of your report is one of your most significant opportunities to interact with your client’s stakeholders. Great reports bring more value to your client and make them look good in front of their colleagues and superiors.
It’s an opportunity to demonstrate your agency’s reliability and attention to detail – all positive traits when you want to secure repeat business.
Well-presented, consistent, and accurate data with actionable recommendations builds trust and establishes your SEO agency as a trusted partner for your clients.
It presents you with upselling opportunities
You become more aware of your client’s needs when you understand their performance. Having a clear starting point will make it easier to develop recommendations and proposals that will resonate with your clients. Consider supporting your recommendations with proven case studies or supporting data where needed.
Speeds up reporting
Managing data duplication across multiple sources is a challenge in marketing. A 2021 Airtable survey of marketing leaders say that 34% of information is duplicated across various sources like spreadsheets, documents, and apps.
Data duplication means more time spent cleaning and aggregating data and less planning and executing SEO strategies for your clients.
Relying on a proven report template customized to your client help save you valuable time putting together reports and more time delivering analysis that helps your clients generate new business.
What to Include in Your SEO Report Template
The most important KPIs that target goals
When selecting an SEO report template, consider not only metrics and data analysis but also design and presentation. Elevate your client reports by opting for free professional templates that can help enhance the visual impact. High-quality design templates integrate seamlessly into your reporting workflow, providing a polished and professional appearance that clients appreciate.
- What is the main objective of this SEO campaign, and how does it relate to my clients?
- Which metrics help me convey what I’m trying to say?
Multiple data sources
An October 2020 Twitter poll by SEO consultant Aleyda Solis reveals that most SEOs use 2-4 paid tools, with some using more than eight tools. With each tool having its way of displaying data and metrics, you’ll need to aggregate the data from multiple sources to tell a cohesive story in your report.
Bonus: Improve your monthly SEO report template with these two elements
Notes and comments
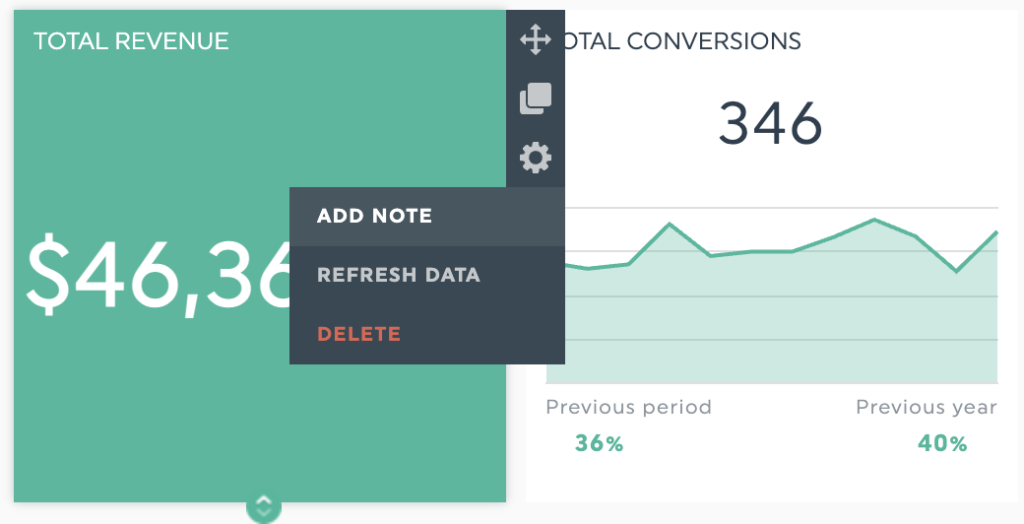
Notes and comments are a fuss-free way to add valuable insights to your data without cluttering an SEO reporting dashboard.
Four examples of things you can include using dashboard notes or comments:
- Summarise critical insights in a few sentences as an overview
- Explain unfamiliar terms or define KPIs
- Include objectives and goals for a KPI
- Explain a data trend or provide more details about an unusual increase or drop in a key metric
Images and visuals
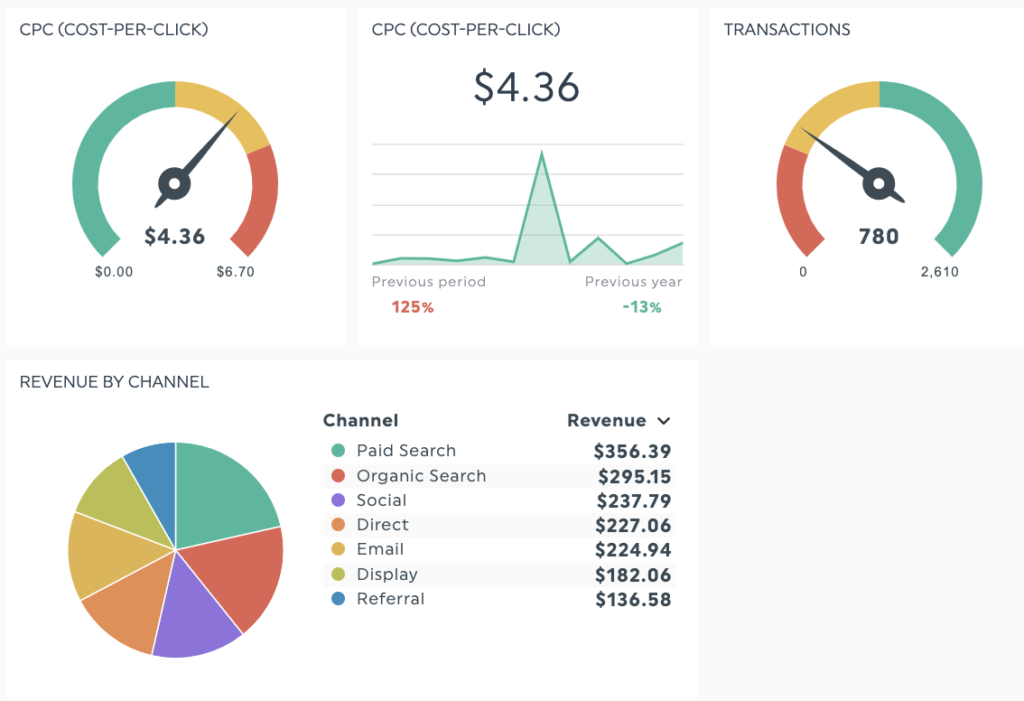
We process images faster than words, so use images to depict relationships, detailed comparisons, or trends in data over time.
Some examples to help you choose the right visuals for your report.
| Objective | Graph | SEO reporting example |
| To see trends | Line or column graph | Tracking organic sessions over time |
| To compare data | Pie, doughnut, or column charts. | Comparing the traffic percentage of referral traffic versus organic traffic to a website. |
| To show the relationship between multiple data sets | Dual-axis line plots | Track the relationship between SERPS and organic performance or domain authority |
| To show progress towards a goal | Gauge charts | Tracking the page speed or the average position of a target keyword for your client’s website. |
To see trends: Line or column graphs.
Example: Tracking organic sessions over time
To compare data: pie, doughnut, or column charts.
Example: Comparing the traffic percentage of referral traffic versus organic traffic to a website.
To show the relationship between multiple data sets: dual-axis line plots
Example: Track the relationship between SERPS and organic performance or domain authority
To show progress towards a goal: Gauge images.
Example: Tracking the page speed or the average position of a target keyword for your client’s website.
Five Time-saving SEO Report Examples
We’ve included five different ways for you to track and report your SEO performance, depending on the campaigns you run and who is reading your report.
SEO report template
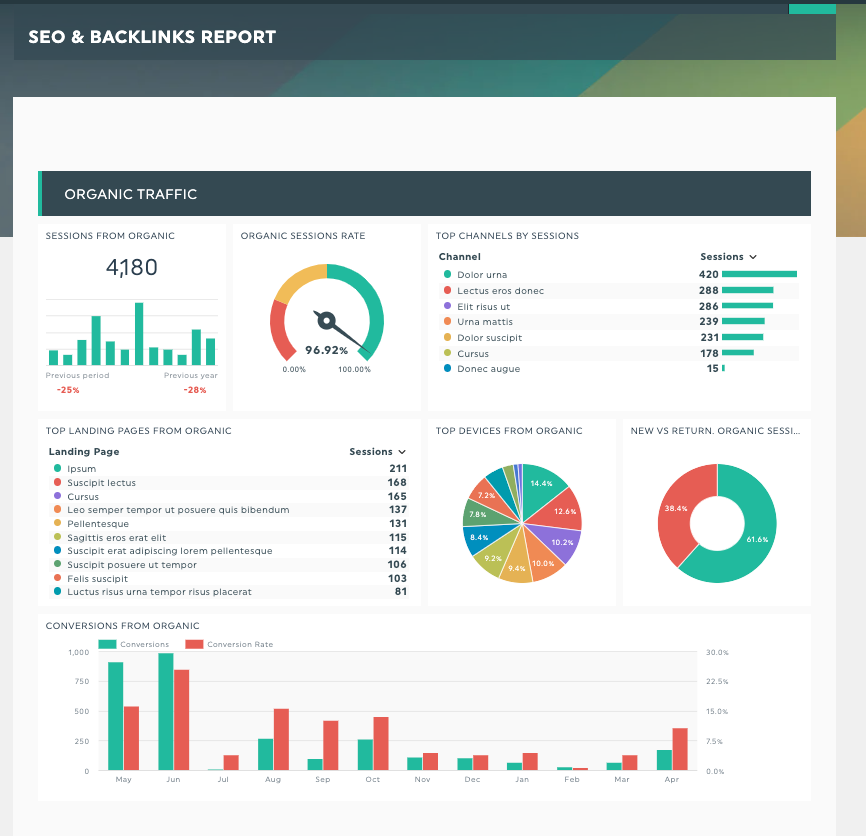
Use DashThis’s SEO report as a starting point for client reports!
We’ve included all key SEO metrics in one dashboard from organic traffic, channel comparison, and landing page ranking, with headers to organize your metrics for your clients.
Digital marketing report template
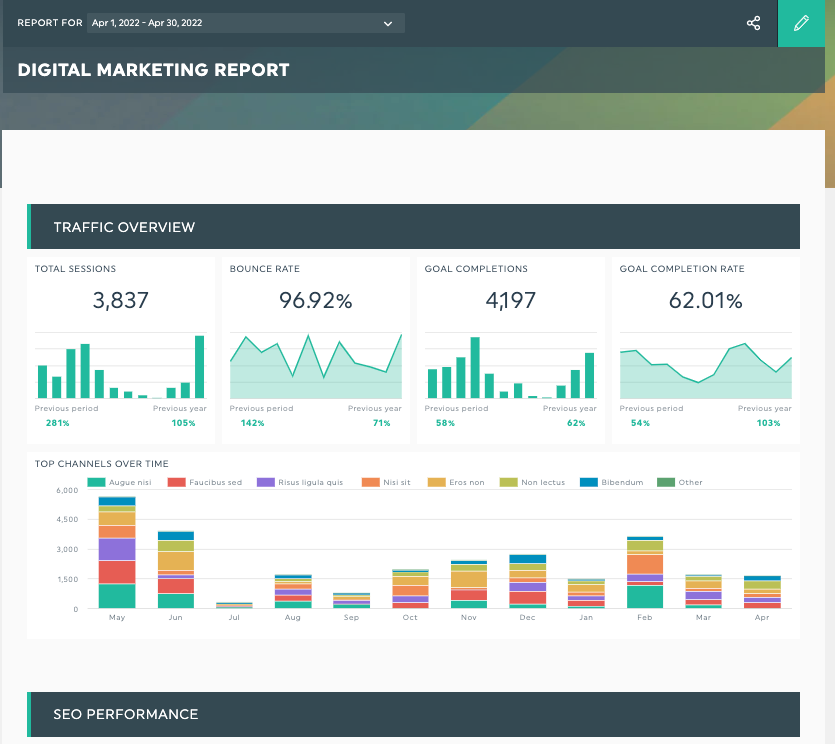
If you’re running multiple digital marketing campaigns and SEO is one of your initiatives for your client, you’re going to love this template.
This template will track organic conversions and search visibility alongside your PPC campaign performance. Feel free to add as many sections as needed for each paid search campaign, with a simple overview on top summarizing what your client needs to know.
Google Analytics report template
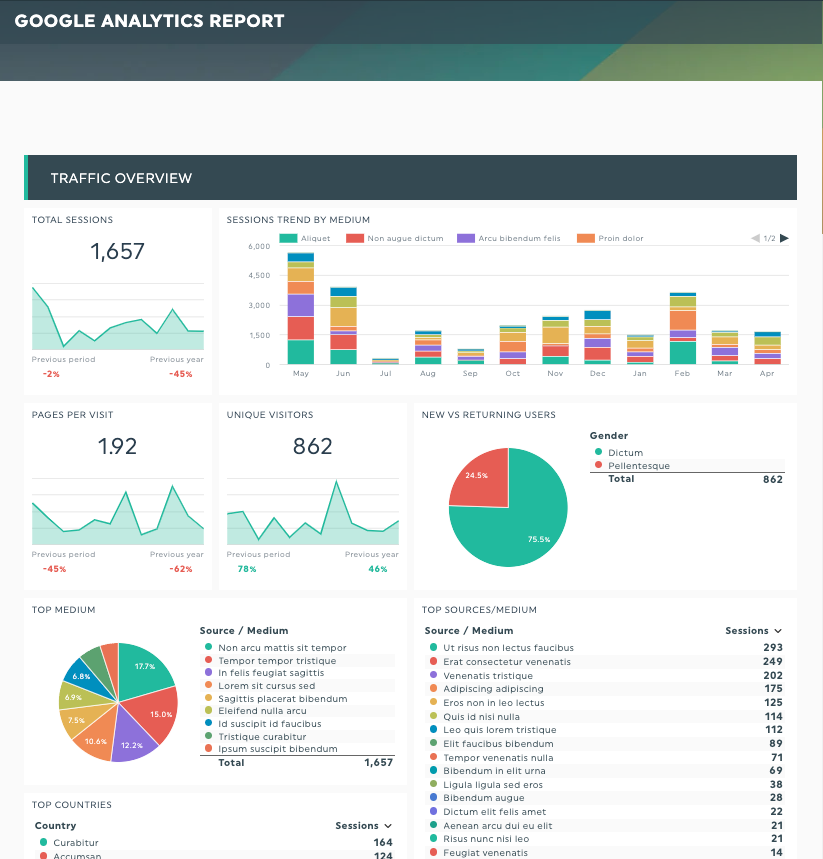
This report covers critical performance metrics like conversion rates and website bounce rates, allowing you to identify improvement points for your client’s website.
Tip: Integrate this report with Google Search Console (GSC) data to get a holistic view of how your SEO efforts affect website performance.
Local SEO report template
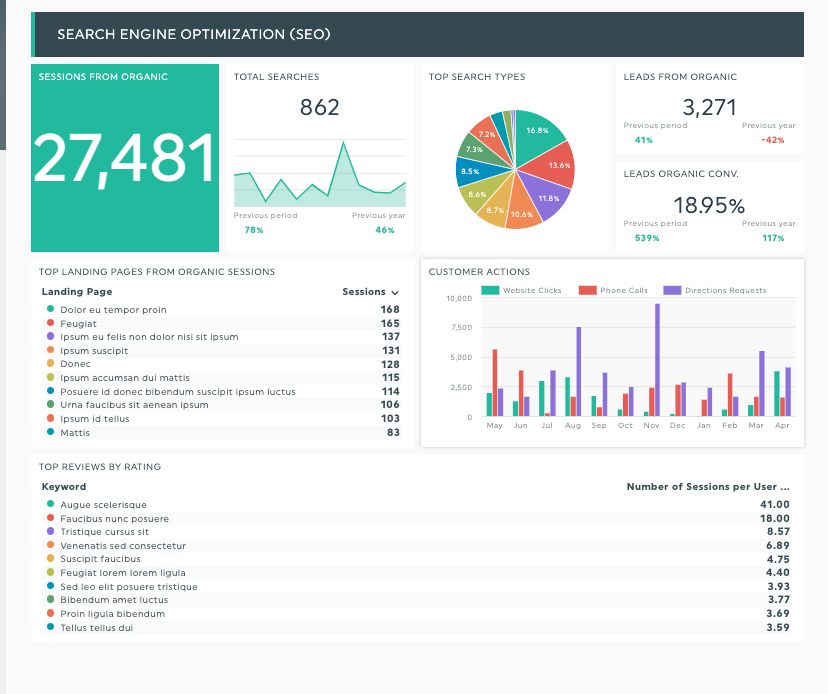
Have local business clients who aren’t well-versed with marketing? Keep your reports focused by talking about metrics busy business owners care about, like their business’s Google review score or how many leads your client’s website generated this month.
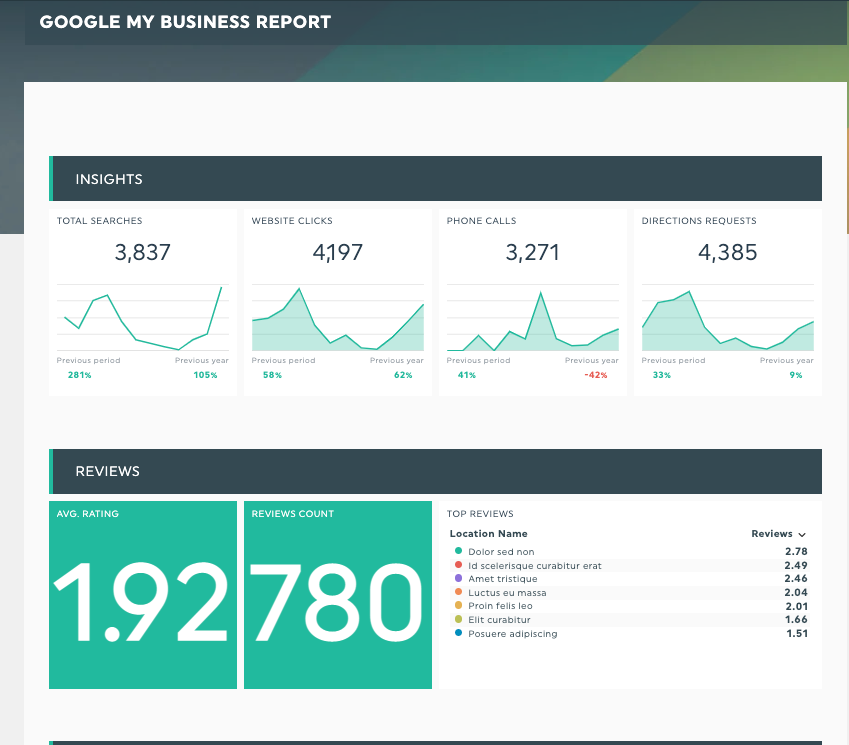
Google Business Profile report template
Google Business Profile is often the first thing potential customers notice if they search for local, F&B, and retail businesses online.
If they want to find a local business’s opening hours, what people have been saying about them, or a contact number to call online, that’s the first place they’ll look.
On top of Google search results, Google Business Profile also affects their discoverability on Google Map results.
With so much online visibility riding on optimizing this business profile, you’ll want to cover your client’s Google Business Profile performance as a dedicated report or as part of your reporting if you work with the above verticals.
How to Create an SEO Report in DashThis?
Step 1: Sign up for an account with DashThis (your first 15 days are on us!)
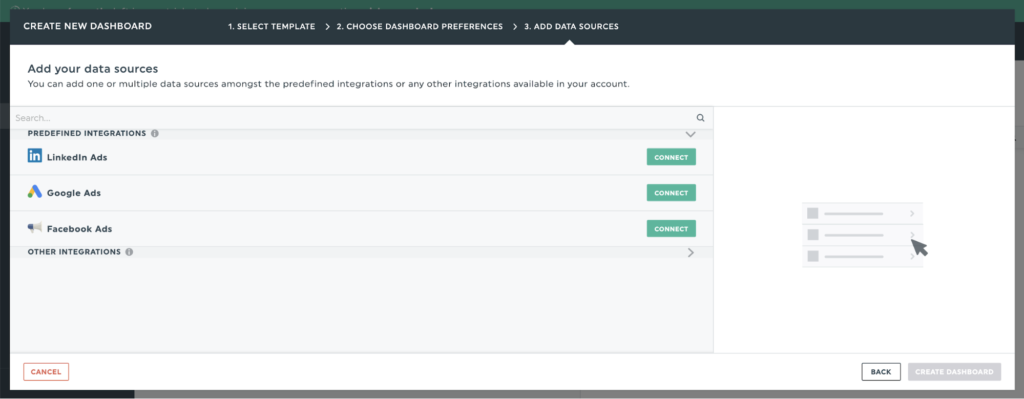
Step 2: Connect your favorite marketing tools in seconds (we support over 40 integrations with top-rated SEO reporting tools, including Ahrefs, Moz, SEMRush, etc.
Step 3: Select the SEO KPIs you wish to track from DashThis’ preset widgets
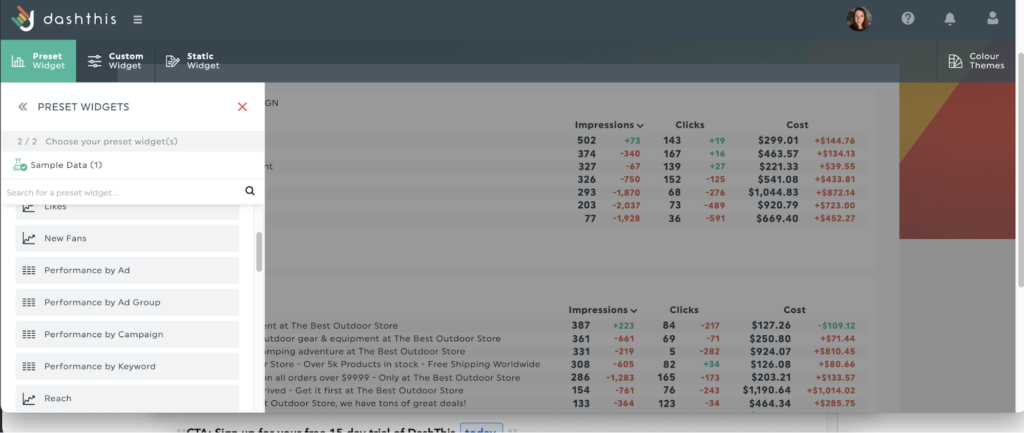
Step 4: Drag and drop as many KPIs as you desire to create your own SEO report.
Create SEO Reports that Wow Your Clients
To recap, five elements that make up an excellent SEO report template for your clients:
- Add an overview of key results and recommendations
- Key metrics relevant to your client’s goals and objectives
- Visuals matter! Use graphs and charts to show relationships between metrics or to communicate progress toward goals.
- Includes analysis and recommendations that help your client make business decisions.
- Automate data aggregation across your marketing tools, so you can focus your time and energy on analysis.
Now, go wow your client in your next reporting session!
Sign up for your free 15-day trial of DashThis today.


