


Marketing Dashboards: Real-World Examples to Track Your Performance
Here is a truth: Marketing dashboards have evolved into more than just a tool.
Much like how a ship’s navigational system steers it through uncharted waters, marketing dashboards display key metrics and play a vital role in aligning and integrating efforts across departments and business units.
In this blog, we’ll discover real-world examples of marketing dashboards, showcasing how they can be used to track performance and optimize strategies.
Key Takeaways
- A marketing dashboard is a response to the increasing complexity of market data faced by senior management. That makes it a powerful tool.
- In a good dashboard, marketing data, which includes sales data, sales area, achievement of KPIs of marketing, and sales distribution, must be displayed accurately.
- Selecting the metrics you monitor on the marketing dashboard is crucial for gaining precise business insights.
- The KPIs on the marketing dashboard depend on the type of template and the marketing activities.
Table of Contents
- What is a Digital Marketing Dashboard?
- Why Marketing Dashboards?
- Digital Marketing Dashboard Examples
- Metrics to Monitor on the Marketing Dashboard
- Choosing the Right Dashboard Marketing Metrics
What is a Digital Marketing Dashboard?
A marketing dashboard is a powerful tool that serves as a visual representation of the most critical marketing metrics, allowing digital marketers, agency owners, and startups to keep track of their performance in real-time.
According to the academic research titled “Why, What, How, and What Research is Needed?,” the marketing dashboard is a “small collection of interconnected key performance metrics and underlying performance drivers that reflect both short- and long-term interests to be viewed in common throughout the organization.”
Insufficiently explicit? In the same research, we can reach the following definition:
Marketing dashboards are a response to the increasing complexity and diversity of market data faced by senior management in the information age.
Why Marketing Dashboards?
The well-known consulting firm Gartner found in recent research that the “ability to measure tactical, strategic, and operational KPIs to monitor campaign, channel, and funnel performance using data visualization and dashboard capabilities,” is one of the steps to nurturing leads and accounts.
By consolidating top-level marketing reports and arranging them on a single page, a marketing dashboard enables quick, at-a-glance monitoring of essential data, such as campaign performance, customer engagement, and ROI. This streamlined view not only aids in making informed, data-driven decisions but also forms the foundational layer for more detailed and comprehensive marketing analytics.
For digital marketers and internet marketing companies, it provides clarity on what strategies are working and what needs adjustment. Agency owners benefit from the ability to oversee multiple campaigns and accounts efficiently. Startups, often operating with limited resources, can use a marketing dashboard to ensure they are focused on the right metrics to drive growth and achieve their marketing objectives.
Now, we are on the same page about how important digital marketing dashboards are. In case you need to be more detailed, check out one of the members of the DAN community, DashThis’ video prepared specifically for beginners:
Digital Marketing Dashboard Examples
In the digital agency world, there is no “one right” option; it’s true for marketing dashboards.
There are many different kinds: the marketing performance dashboard, KPI dashboard, e-commerce dashboard, online marketing dashboard, social media dashboard, search engine optimization dashboard, lead generation dashboard, and even for each platform and tool commonly used.
For that reason, let us introduce you to the digital marketing dashboards created by DAN members.
Whatagraph
A DAN-member tool, Whatagraph is a highly user-friendly marketing dashboard; it easily connects cross-channel data and helps you customize data visualizations with minimum hassle.
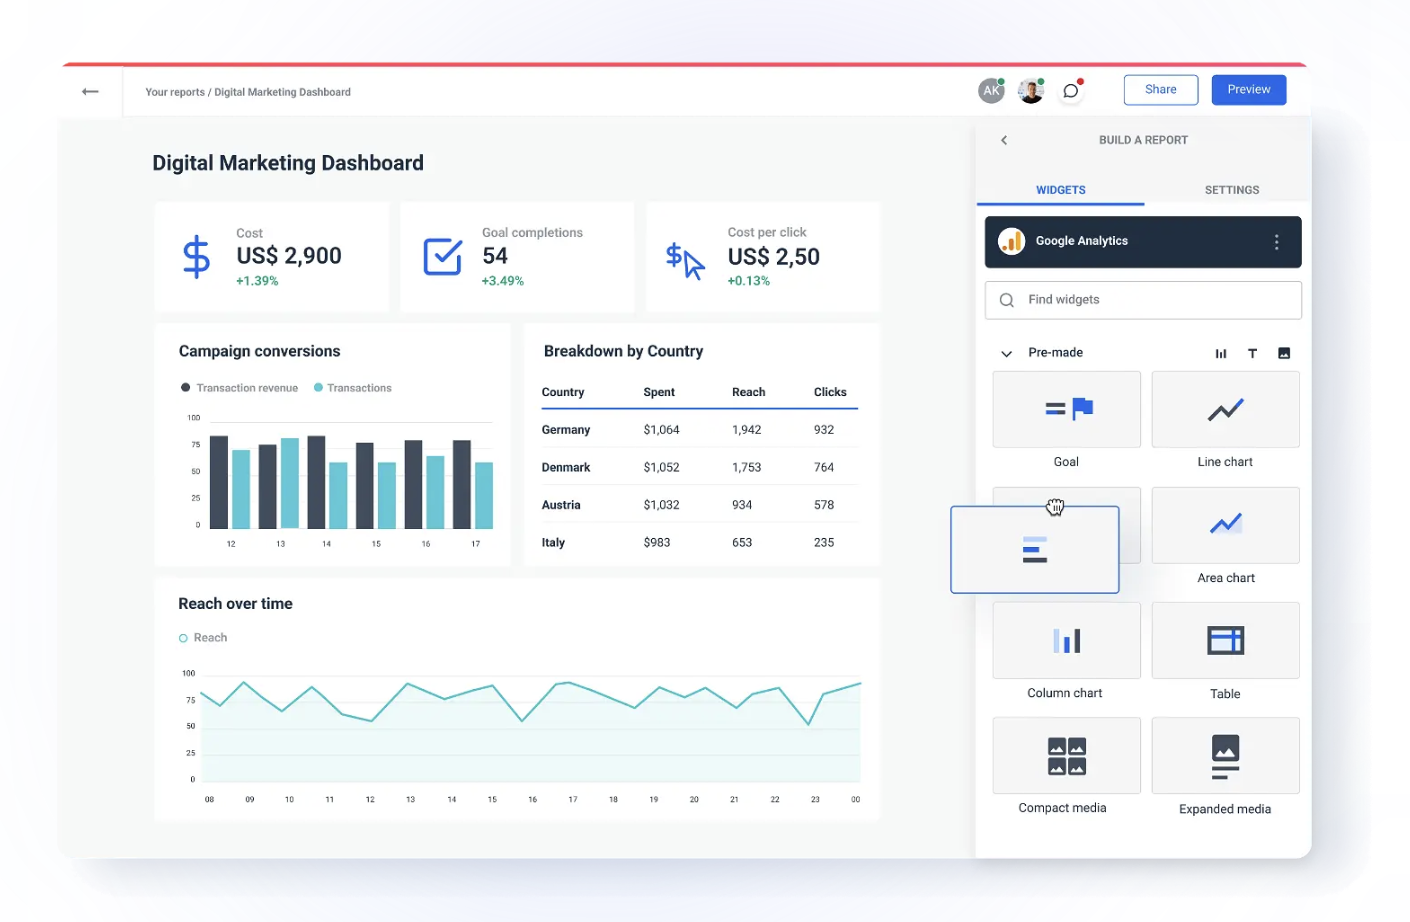
That marketing dashboard allows you to create your reporting platform, combine insights from multiple sources, and pull data from multiple integrations, including Google Sheets and BigQuery.
Whatagraph helps users to build:
- Facebook Ads Dashboard
- YouTube Performance Dashboard
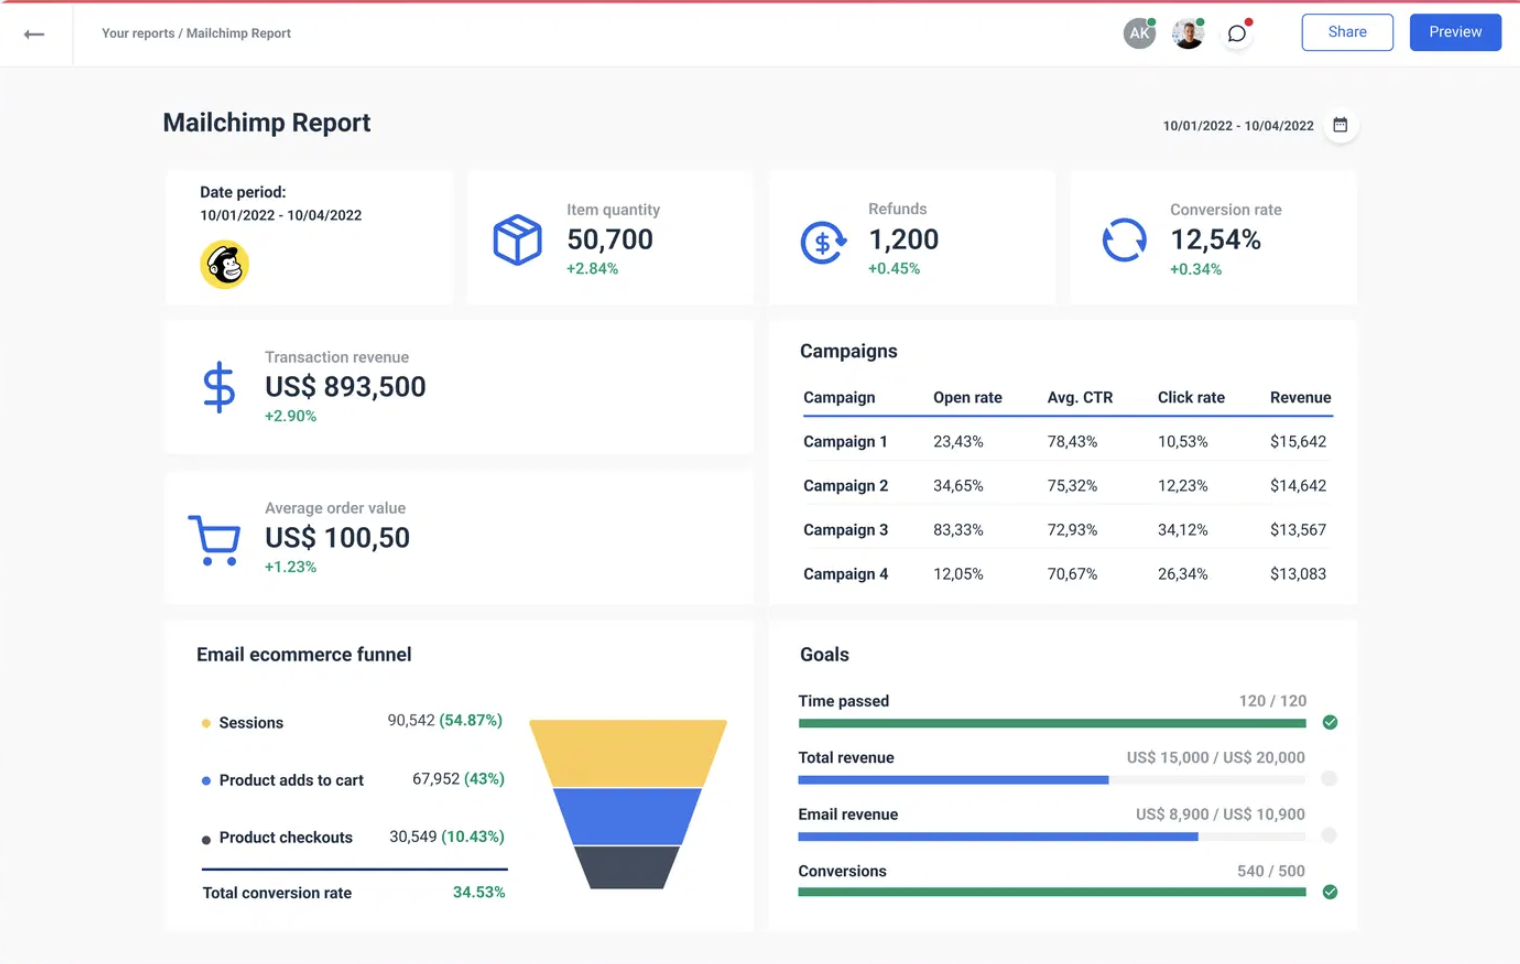
- Mailchimp Campaign Report
- Adroll Report
- StackAdapt Dashboard
- Google My Business Dashboard
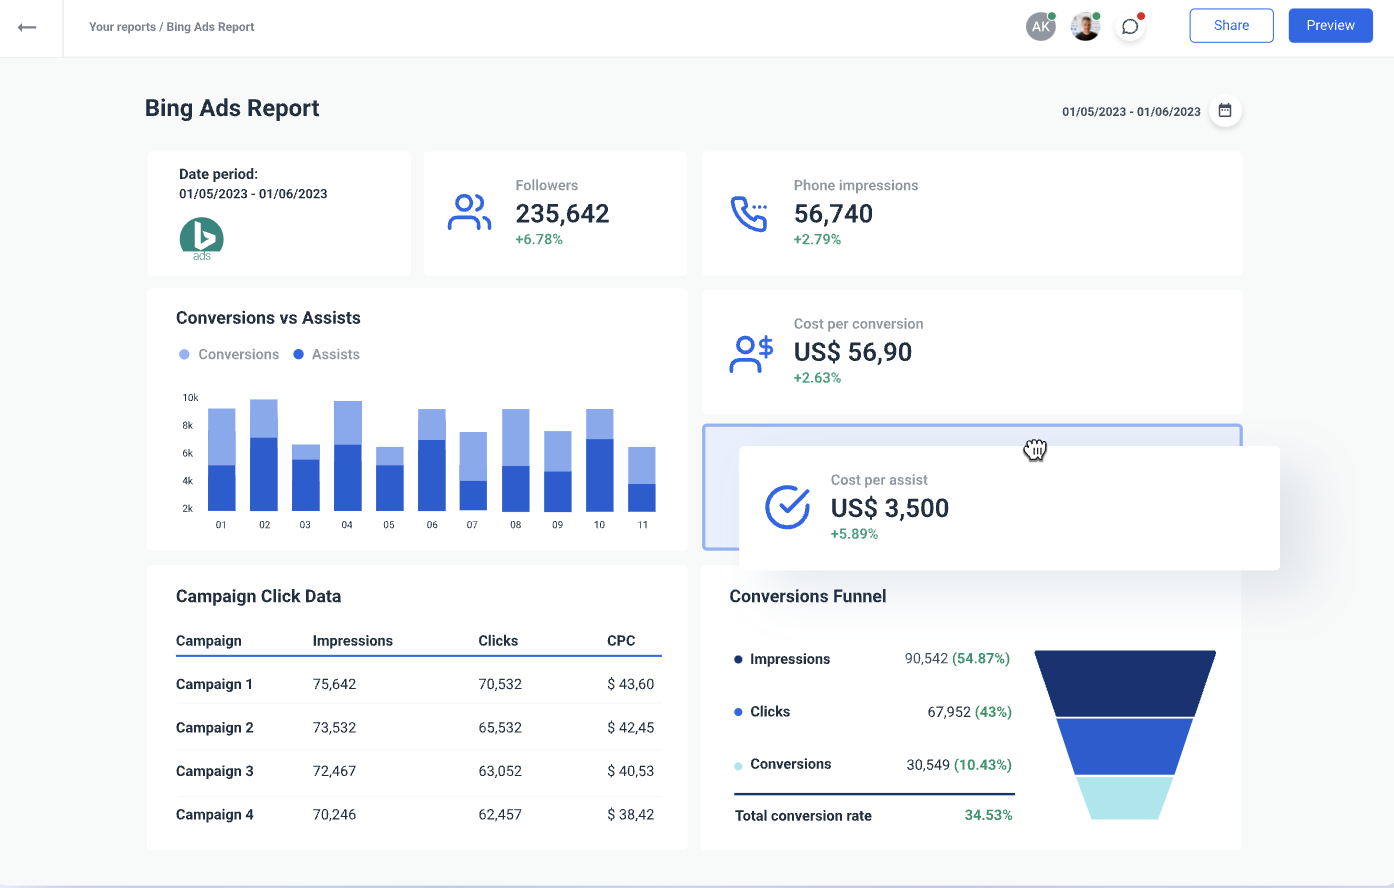
- Bing Ads Report
- Multi-Channel Email Dashboard
- X Ad Report
- Sells Call Dashboard (CallRail, etc.)
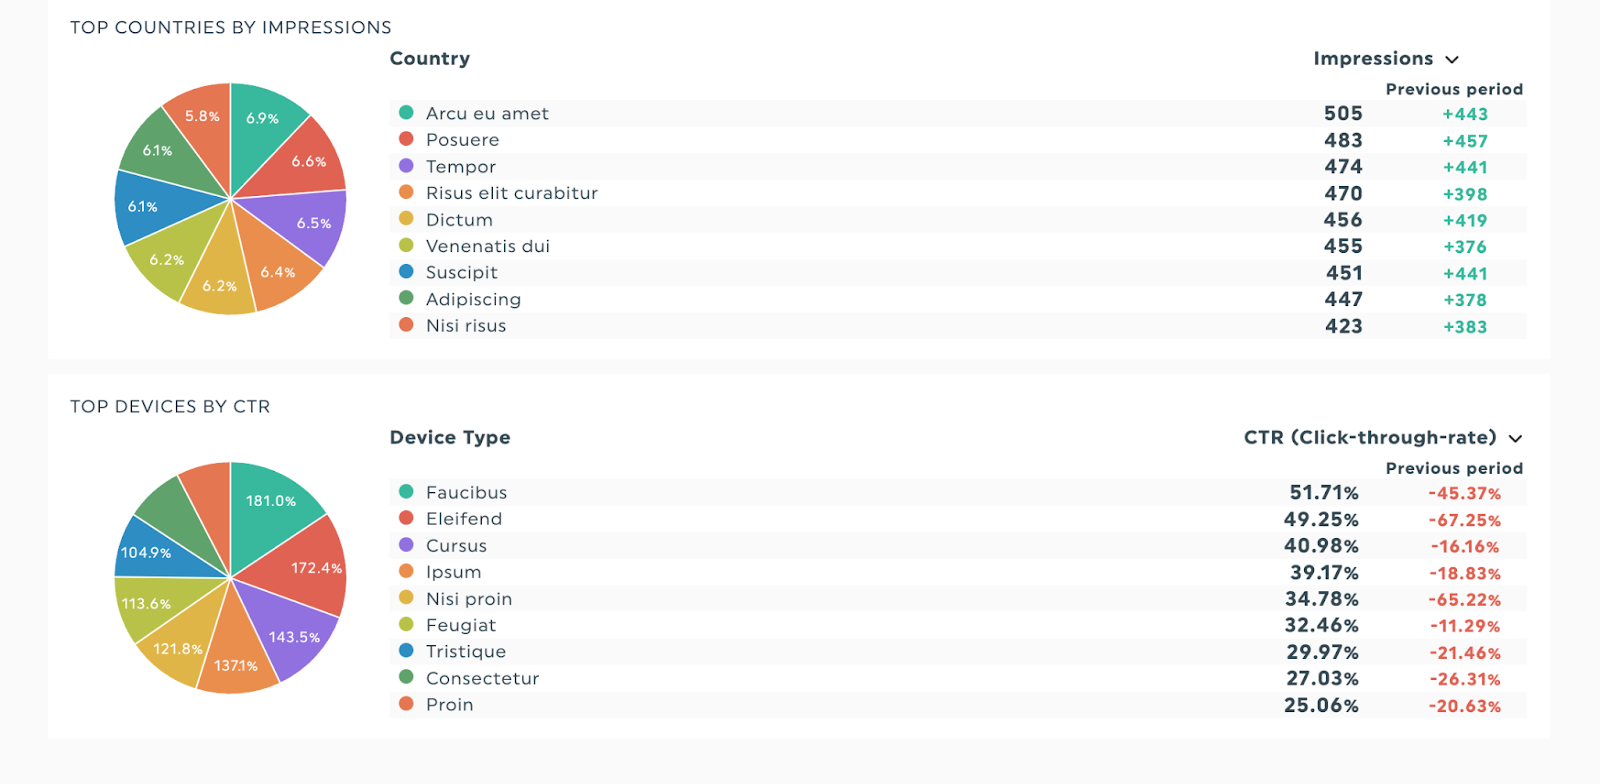
Want to see some examples? Bing Ads report:
Mailchimp Dashboard:
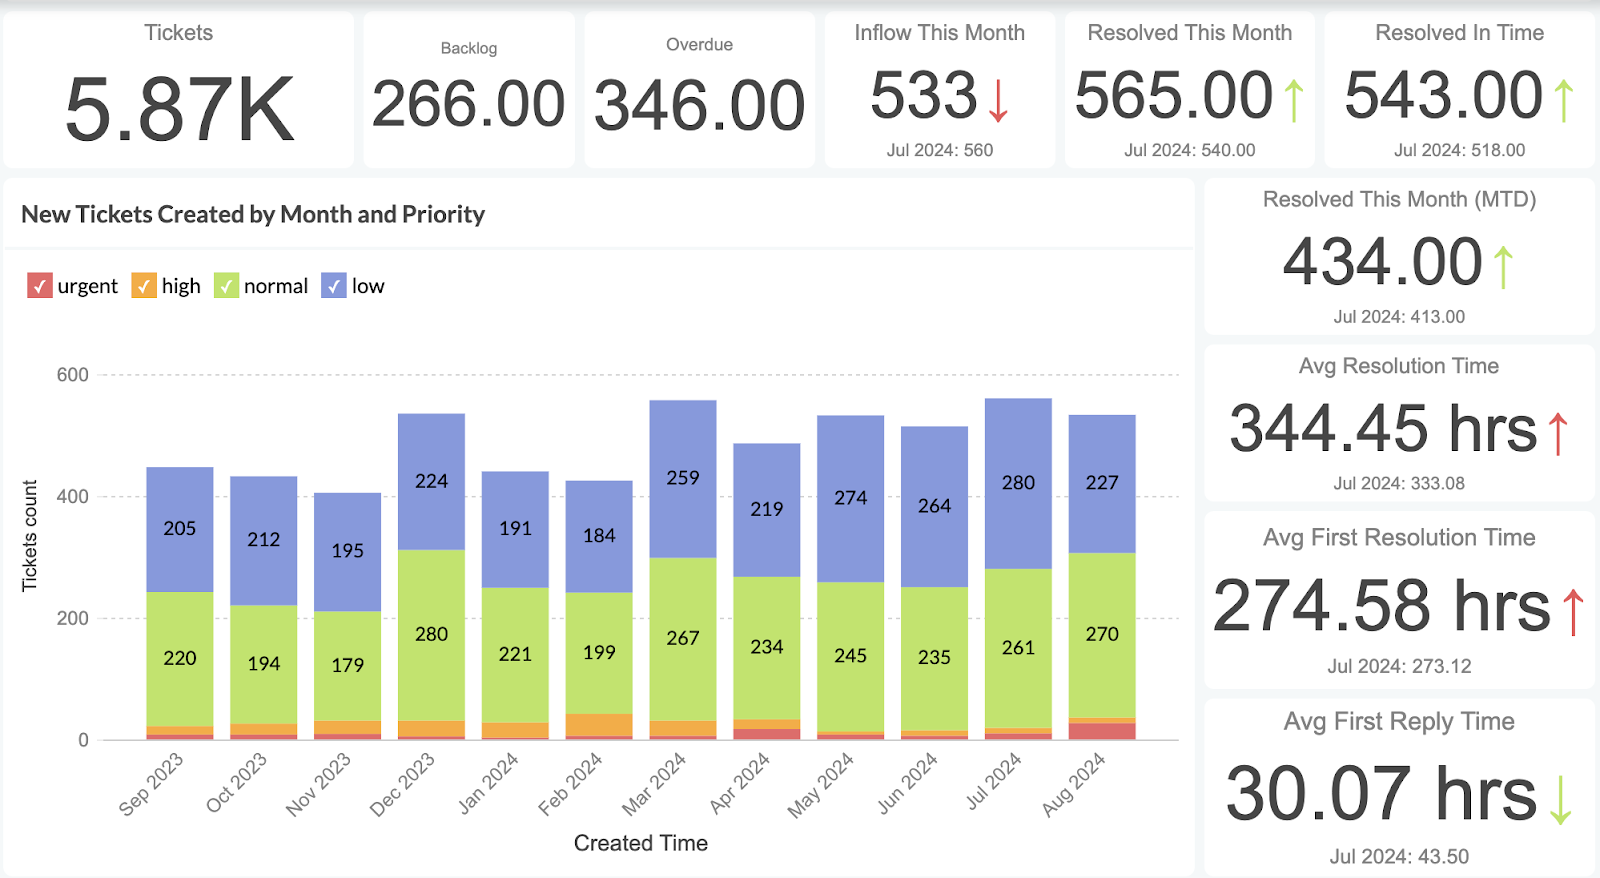
DashThis
Another DAN-member tool, DashThis, basically keeps the number of metrics down to a few that can be applied to virtually all settings. The dashboard has the advantage of comparability, allowing benchmarking across agency units, firms, projects, and periods.
With its default KPIs and widgets, you can easily start using your dashboard—an all-in-one automated marketing report.
Described as the “easiest reporting platform in the market,” DashThis lets you measure the success of your marketing efforts and link all of your reporting tools to your account seamlessly.
The tool presents the following templates as dashboards:
- PPC & SEM Report
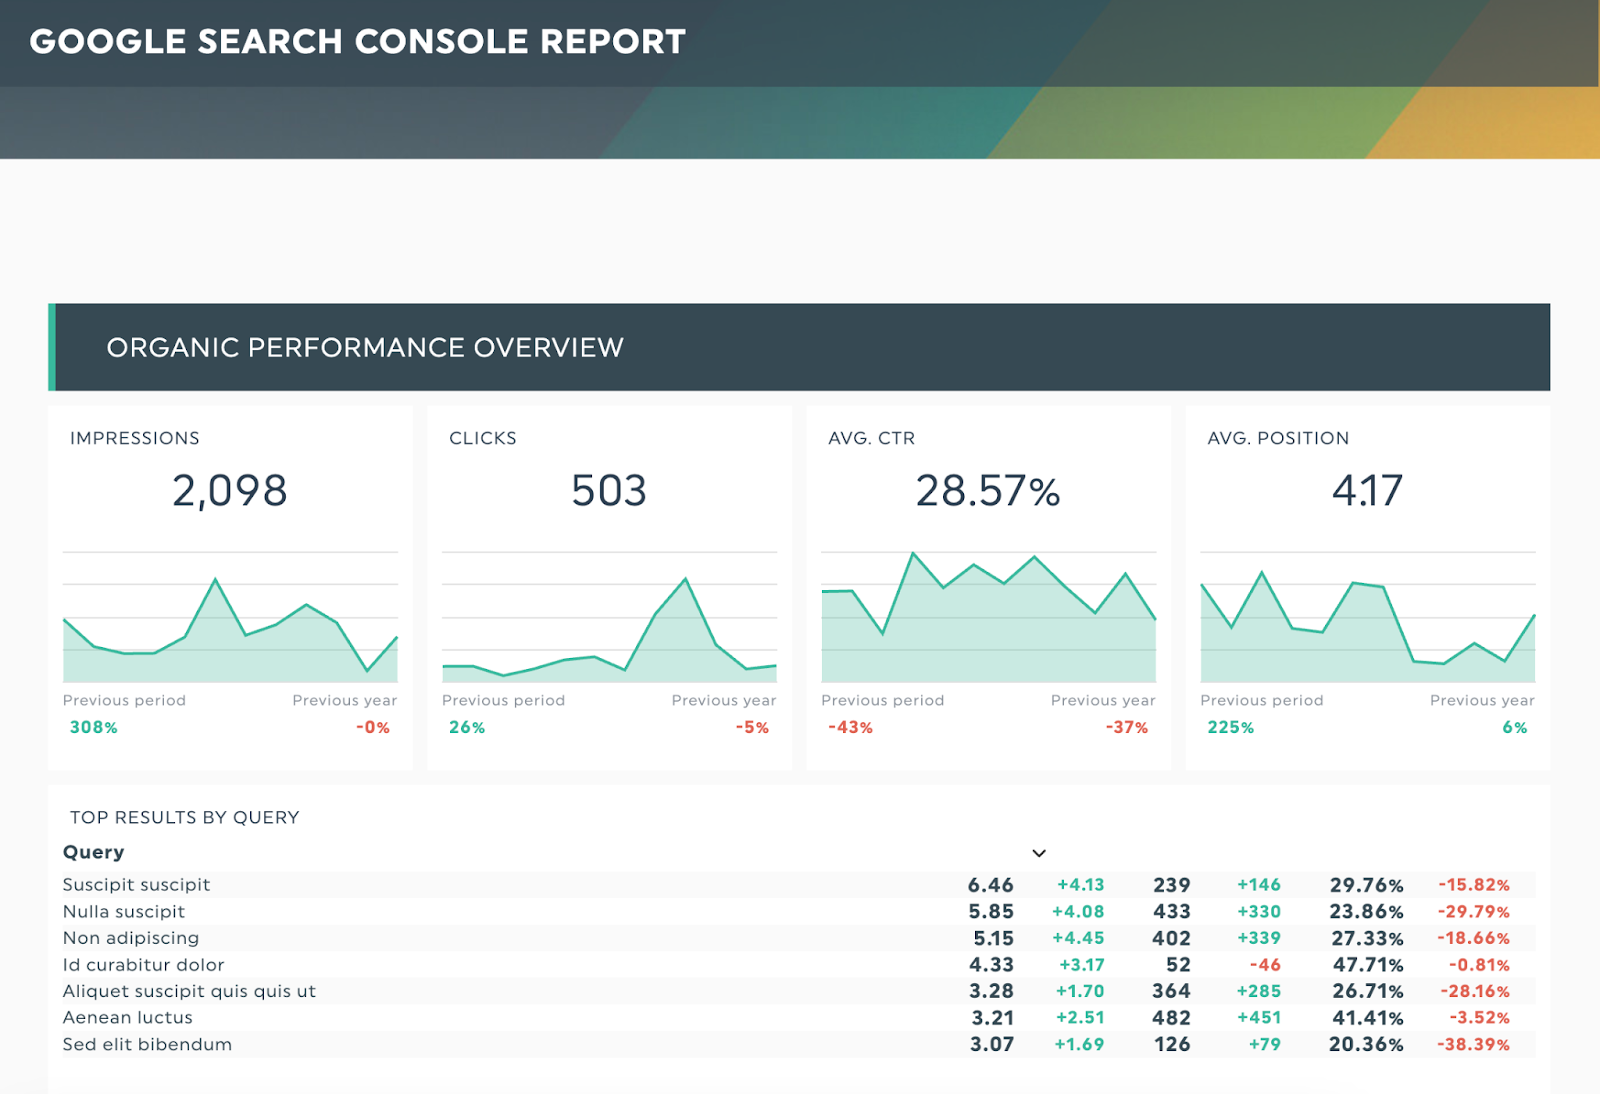
- Google Search Console Report
- Google Adwords Dashboard
- Klaviyo Dashboard
- Facebook Business Manager Dashboard
- Instagram Ads Report
- Marchex Dashboard
- Moz Dashboards
- Ahrefs Dashboards
Here is a look from DashThis’ Google Search Console Dashboard:
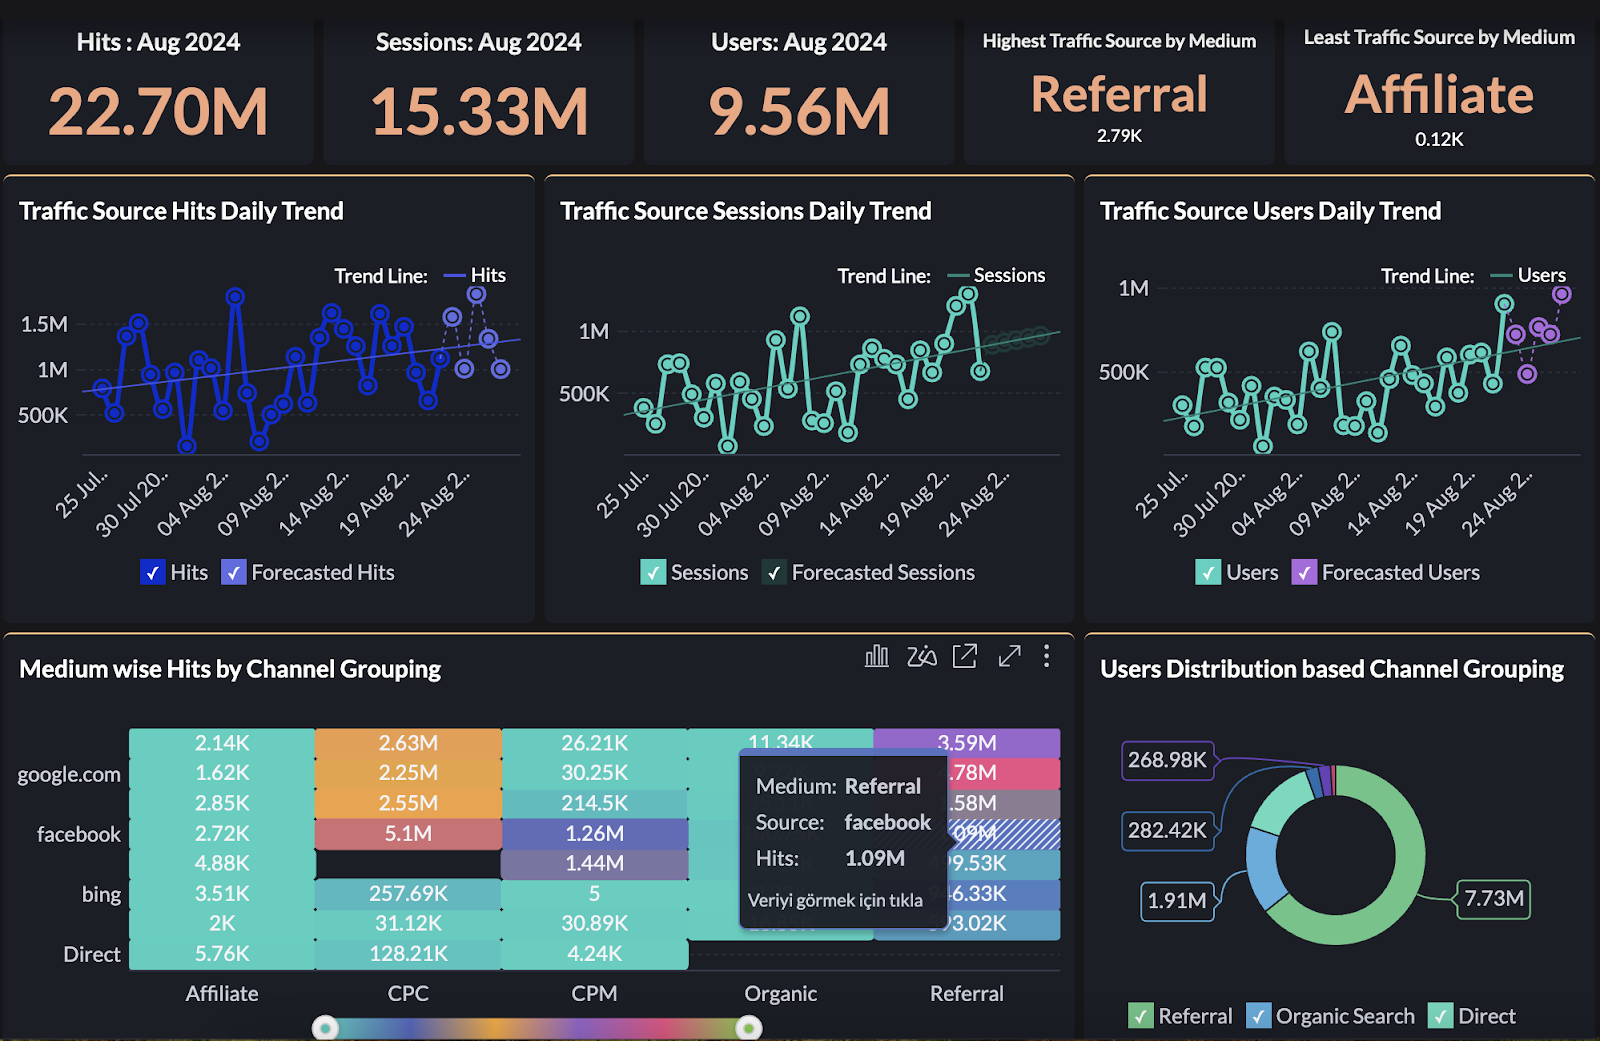
Zoho Analytics
With a drag-and-drop feature, Zoho Analytics is a great example of how building marketing dashboards takes minutes.
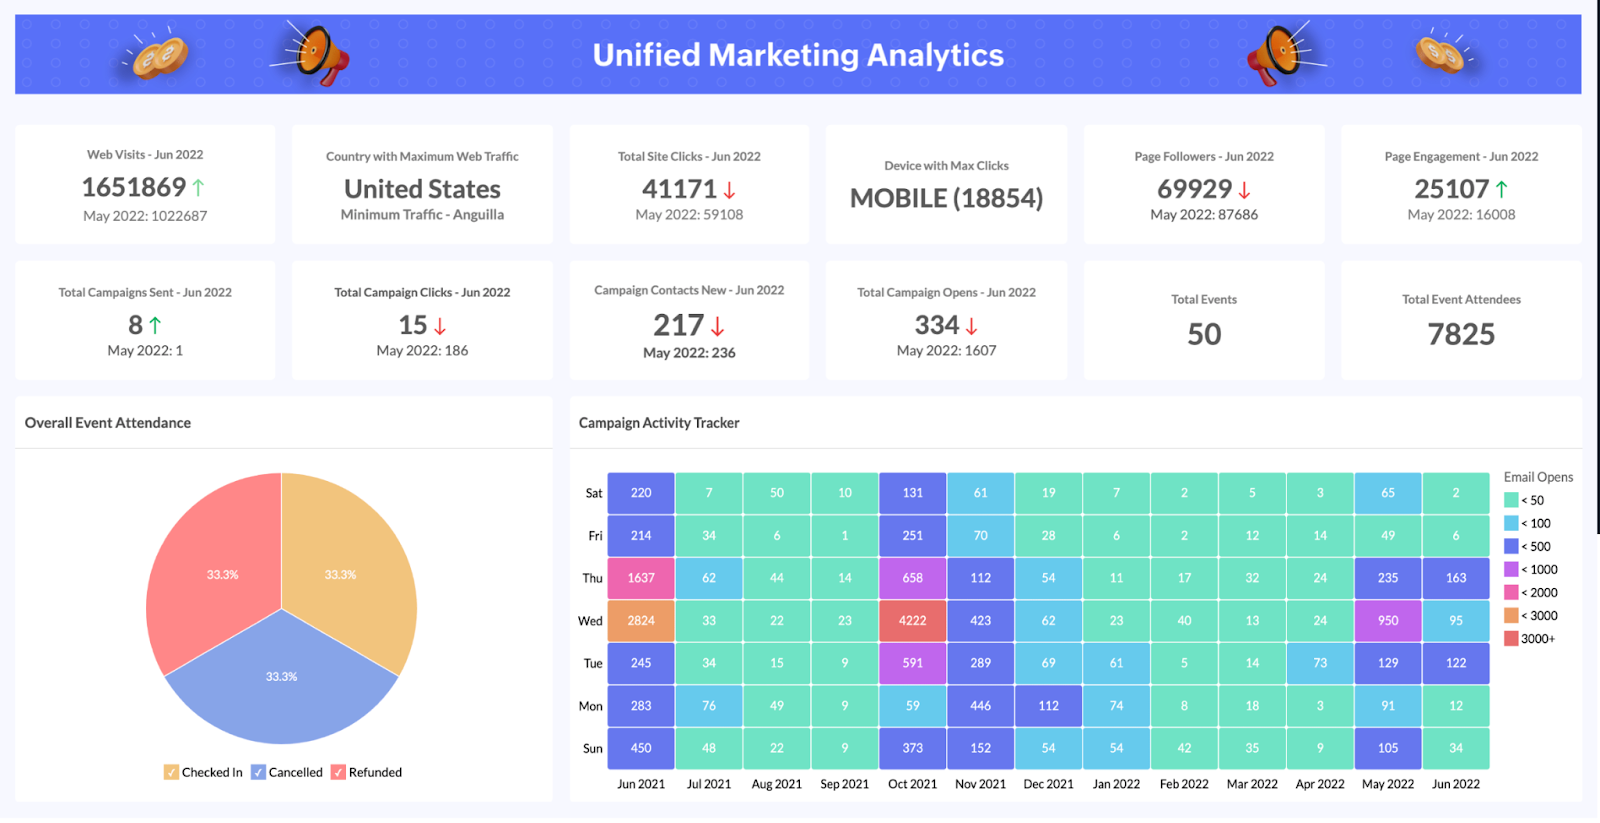
Here is an example of the Zoho Analytics Unified Marketing Analytics dashboard:
Zoho Analytics, which is integrated with more than 25 popular business applications like Salesforce CRM, QuickBooks, Xero, Zendesk, etc., includes the following digital marketing dashboards:
- Google Analytics Advanced Reporting
- Semrush Advanced Analytics Dashboard
- Advanced Analytics for HubSpot Marketing
- YouTube Ads Advanced Analytics
- LinkedIn Ads Advanced Analytics
- Facebook Pages Advanced Analytics
- Eventbrite Advanced Analytics
- Salesforce CRM Dashboard
- Zendesk Advanced Analytics Dashboard
Here are some screenshots from Zoho Analytics dashboards.
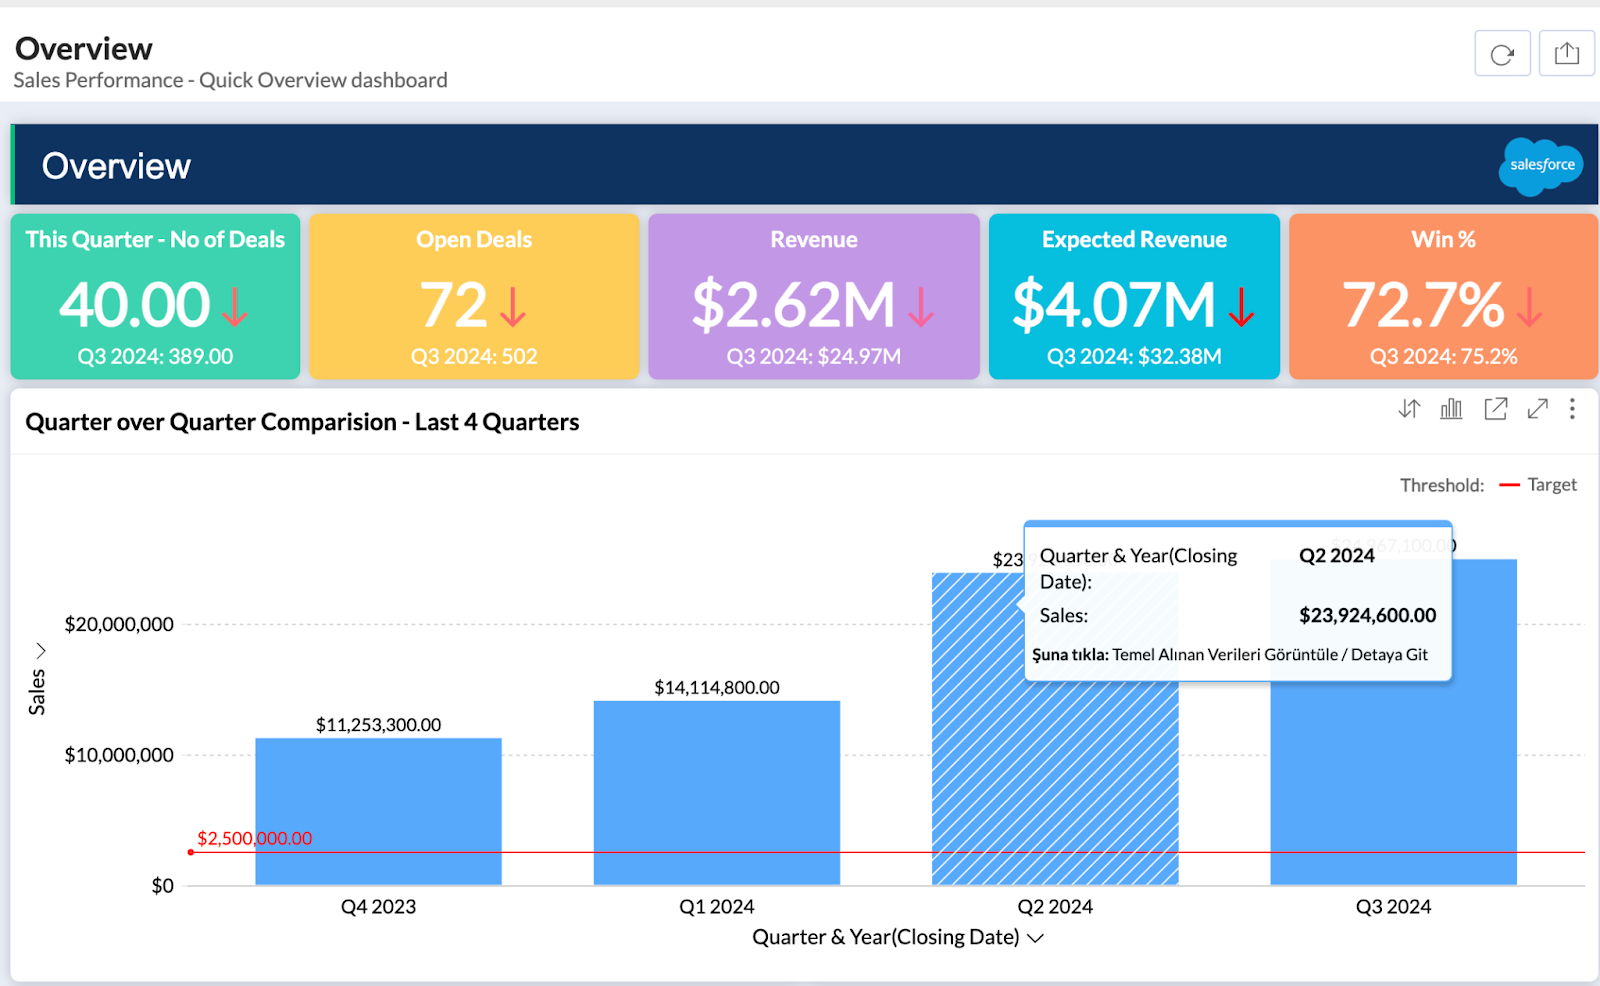
For Salesforce:
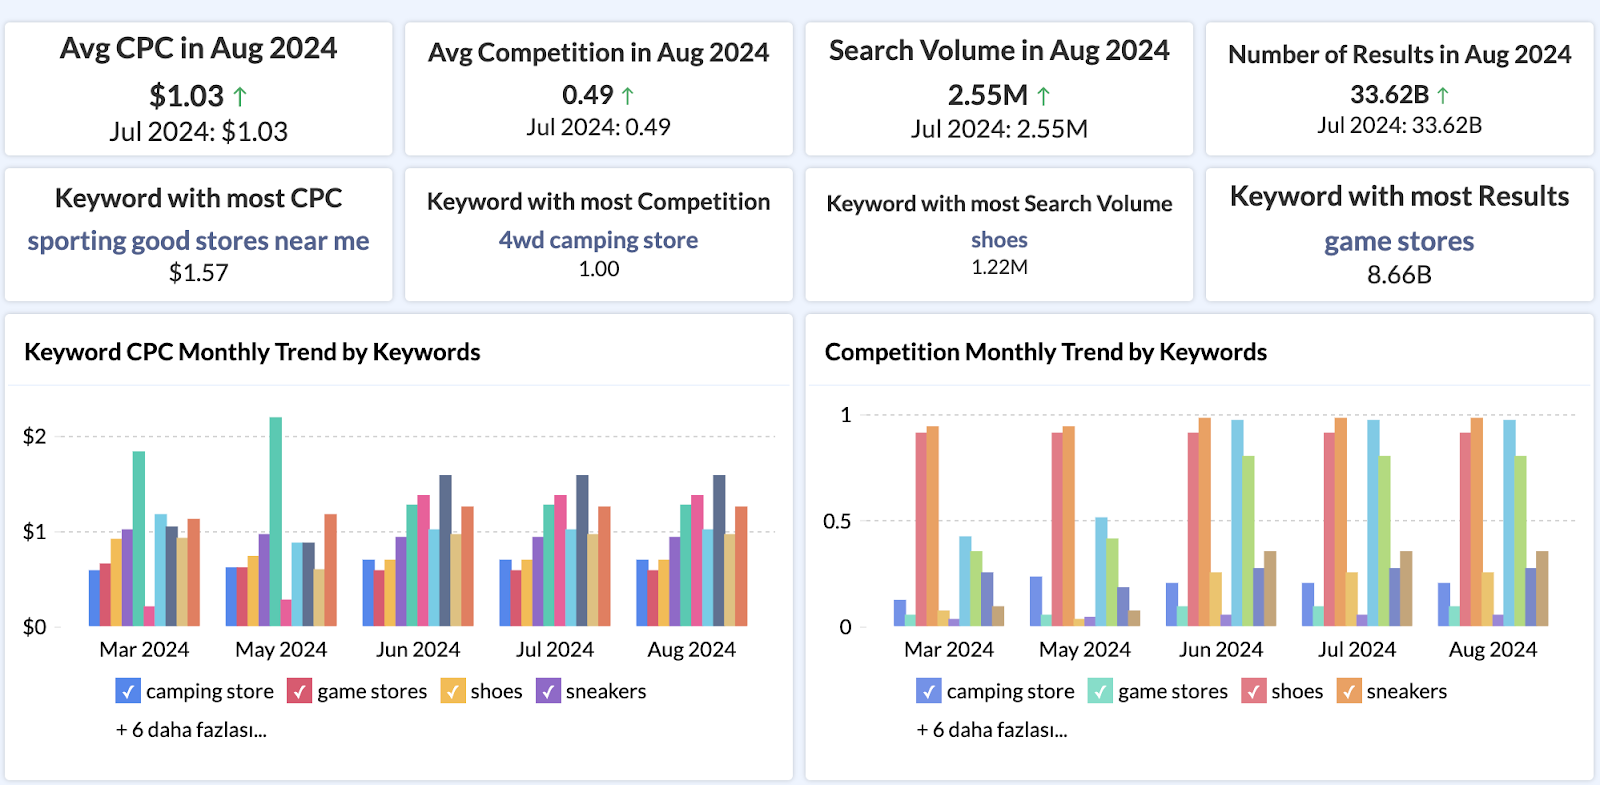
For Semrush:
For Zendesk:
For Google Analytics – G4:
Metrics to Monitor on the Marketing Dashboard
For now, we have seen a piece of marketing dashboards with different metrics. However, when can you describe a digital marketing dashboard as a “good fit” for your business or brand?
The answer lies in metrics.
Actually, in a good dashboard, marketing data, which includes sales data, sales area, achievement of Key Performance Indicators (KPI) of marketing, and sales distribution, must be displayed clearly and accurately.
According to Gartner’s 2021-dated research, “Prioritize Marketing Metrics for Your Executive Dashboards,” the digital marketing ecosystem has no chance to ignore performance metrics on marketing dashboards:
Digital marketing leaders who fail to prioritize metrics for their dashboards risk causing their stakeholders information overload. This may result in dashboard abandonment over time. Use this tool to select the critical metrics that demonstrate how marketing adds business value.
So now, it is crystal clear that metrics you track on the marketing dashboard mean a lot to get an accurate insight about your business.
Choosing the Right Dashboard Marketing Metrics
The good news is that the metrics for your business are not so different than the top KPIs of digital marketing; so, in case you’re familiar with insights on Google Analytics or social media platforms, you are already half way there.
Besides, the KPIs and metrics to monitor on the marketing dashboard depend on the type of template and the marketing activities. However, almost every template and dashboard track the traffic, conversion rate, page views, organic search performance of your landing pages, website, etc.
Let’s get a quick look at specific metrics for the marketing industry:
- Click-Through Rate (CTR): You can track the ratio of clicks to impressions in digital ads or emails, providing insight into the appeal and relevance of the content.
It is best to use it in social media tracking dashboards and email marketing dashboards.
- Cost Per Acquisition (CPA): You can get information about the average cost to acquire a new customer, helping marketers evaluate the efficiency of their spending.
Vital for paid advertising dashboards (PPC) and campaign performance dashboards.
- Return on Investment (ROI): You can evaluate the profitability of marketing activities, determining whether campaigns are delivering value relative to their cost.
Best for performance dashboards and C-suite executive dashboards.
- Customer Lifetime Value (CLV): It helps you estimate the total revenue a customer will generate over their relationship with your brand, guiding long-term marketing strategies.
Best for CRM dashboards and e-commerce dashboards.
- Bounce Rate: It indicates the percentage of visitors who leave a site after viewing only one page.
Best for website optimization dashboards and content performance dashboards.